Hi Dojo
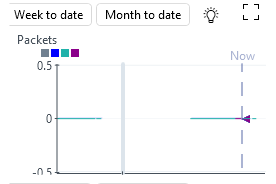
I would like to display a small trend graph in View.
Is there any way to hide the date range buttons?
Also, this parameter starts at 0 and only accumulates.
So no negative value is needed, but can I omit it and make 0 the starting point of the graph?
min=0 did not work.

Yuki Arakawa(3496) 荒川 祐貴 [DevOps Advocate] Selected answer as best
Vikas' alternatives can be helpful tools.
To answer your questions specifically:
- The range buttons cannot be hidden. What most users do is put another non-transparent shape on top of it in the same color as the background. That way you can't see the buttons (but they are still there).
- If a parameter value is static and you use auto scaling, some padding is given to the top and bottom of the graph, making the graph "1" high in total. If we were to place the "0" value at the bottom of the y-axis, it would literally overlap with the x-axis, which we personally find worse to look at. There is no option to set the y axis range from the shape data as the y axis range is controlled by a user setting. You can modify this user setting to use auto range or fixed. If you choose fixed, the trend graph will determine the range at the start based on the parameter range as described in the protocol. If there is no such thing, it will take the outer bounds of your data. Again though, some padding will always be added if your value is static.
Toon Casteele [SLC] [DevOps Enabler] Answered question