Hi Dojo,
I'm investigating an issue where an element hosted in a remote DMA appears as not active in Cube:
Interestingly, this element shows up correctly in other DMAs, including on the hosting agent.
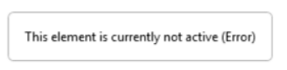
One thing that caught my attention is that the element displays the following icon in the agent where it appears inactive:

Does anyone know what that icon means?
Hi Juan,
Is it a replicated element from a different cluster?
Or same cluster, just different DMA showing a different element status depending on where you connect with Cube?
If the latter, then the icon might be just a consequence of some lack of sync - but should be different on the hosting DMA.
If replicated, instead, might be a consequence of the "hosting-receiving" DMA that has an active element but in conflict with the state of the element on the "source" DMA.
In terms of the icons, I've seen something similar when the element cannot get alarms or generic element data (e.g. in case of issues on the underlying Cassandra DB) - but in my case there was also an RTE logged and I'm not too familiar with the modern icons - I personally prefer the clarity of the classic set:
you might try changing the client settings in CUBE and see if something clearer comes up (I also keep timeout separates from other severities)
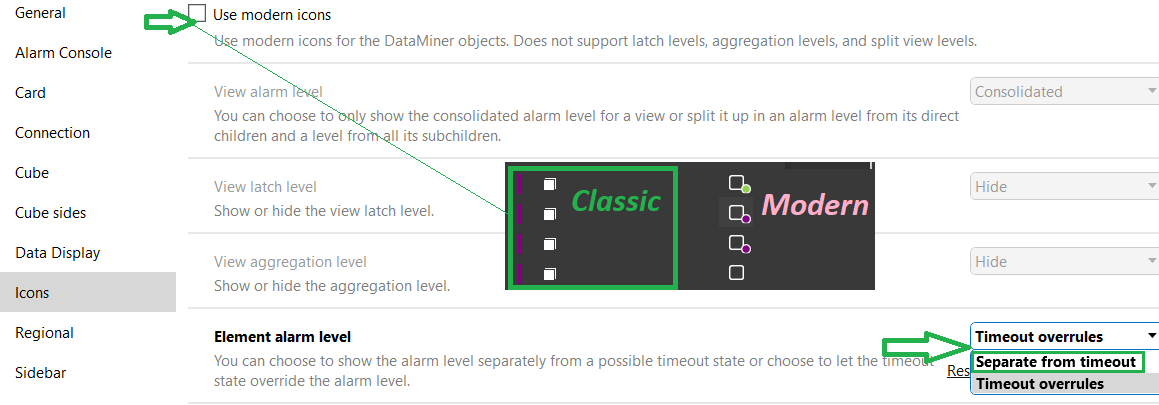
The grey dot seems to point to an active severity that is no longer retrieved for your element - hence the grey - but I seem to recall modern icons do not support latch-level, so definitely something that is worth checking with the classic set too.
HTH
Thank you Alberto!
It's hosted on a DMA in the same cluster, and you're right! The hosting DMA does show the expected icon.
Regarding the icons, I'll check the classic set, it's something I didn't test. I'll also check the classic icon set, as that's something I hadn’t tested yet. Thanks again for the heads-up!