Hello guys,
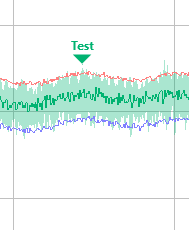
How can we get the value of the Peak from spectrum trace? I looked on the protocol parameters, and I did not find any place where this value is "saved"; Our goal is getting this value of attenuation - as on the "Test" marker at the image - to show it in a visio drawing.


Kind regards,
Yohan
Hi Yohan - if you want to perform spectral measurements, and derive variables from that (such as the Peak in your example), you need to create 1) a spectrum script that performs the measurement that you want, and 2) a monitor that executes your spectrum script at regular time intervals. The result of that will be a new set of variables (e.g. in your case that Peak), and this variable is the same as any other metric (i.e. you can alarm on it, trend it over time, and it is available to be visualized on the UIs.) This is how you do it: Spectrum analyzer scripts and monitors | DataMiner Docs
Hope that answers your question. If not, don't hesitate to further elaborate.