Skip to content
DataMiner DoJo

More results...

Generic selectors
Exact matches only
Search in title
Search in content
Post Type Selectors
Search in posts
Search in pages
Search in posts
Search in pages
Log in
Menu
  • Updates & Insights
  • Questions
  • Learning
    • E-learning Courses
    • Empower Replay: Limited Edition
    • Tutorials
    • Open Classroom Training
    • Certification
      • DataMiner Fundamentals
      • DataMiner Configurator
      • DataMiner Automation
      • Scripts & Connectors Developer: HTTP Basics
      • Scripts & Connectors Developer: SNMP Basics
      • Visual Overview – Level 1
      • Verify a certificate
    • Video Library
    • Books We Like
    • >> Go to DataMiner Docs
  • Expert Center
    • Solutions & Use Cases
      • Solutions
      • Use Case Library
    • Markets & Industries
      • Media production
      • Government & defense
      • Content distribution
      • Service providers
      • Partners
      • OSS/BSS
    • Agile
      • Agile Webspace
      • Everything Agile
        • The Agile Manifesto
        • Best Practices
        • Retro Recipes
      • Methodologies
        • The Scrum Framework
        • Kanban
        • Extreme Programming
      • Roles
        • The Product Owner
        • The Agile Coach
        • The Quality & UX Coach (QX)
    • DataMiner DevOps Professional Program
      • About the DevOps Program
      • DataMiner DevOps Support
  • Downloads
  • More
    • DataMiner Releases & Updates
    • Feature Suggestions
    • Climb the leaderboard!
    • Swag Shop
    • Contact
    • Global Feedback Survey
  • PARTNERS
    • All Partners
    • Technology Partners
    • Strategic Partner Program
    • Deal Registration
  • >> Go to dataminer.services

severity duration – option not available to custom an alarm console

Solved765 views9th January 2025Alarm Console custom alarm console filter severity duration
1
Simon Nenez [DevOps Advocate]414 13th May 2024 1 Comment

Hi Dojo,

On my alarm console I can add the column “severity duration” to have the duration of my alarm. Perfect.

Now I would like to use this severity duration on my filtered alarm console, but this parameter “severity duration” is not available to use it.

My goal is to create an alarm console displaying only alarms which are active for more than 48 hours.

How can I do it without Severity duration ?

Nathan Sciani [DevOps Member] Answered question 9th January 2025
Marieke Goethals [SLC] [DevOps Catalyst] commented 27th September 2024

I see that this question has been inactive for some time. Do you still need help with this? If not, could you select Miguel’s answer (using the ✓ icon) to indicate that the question is resolved?

3 Answers

  • Active
  • Voted
  • Newest
  • Oldest
2
Miguel Obregon [SLC] [DevOps Catalyst]19.15K Posted 13th May 2024 0 Comments

Hi Simon,

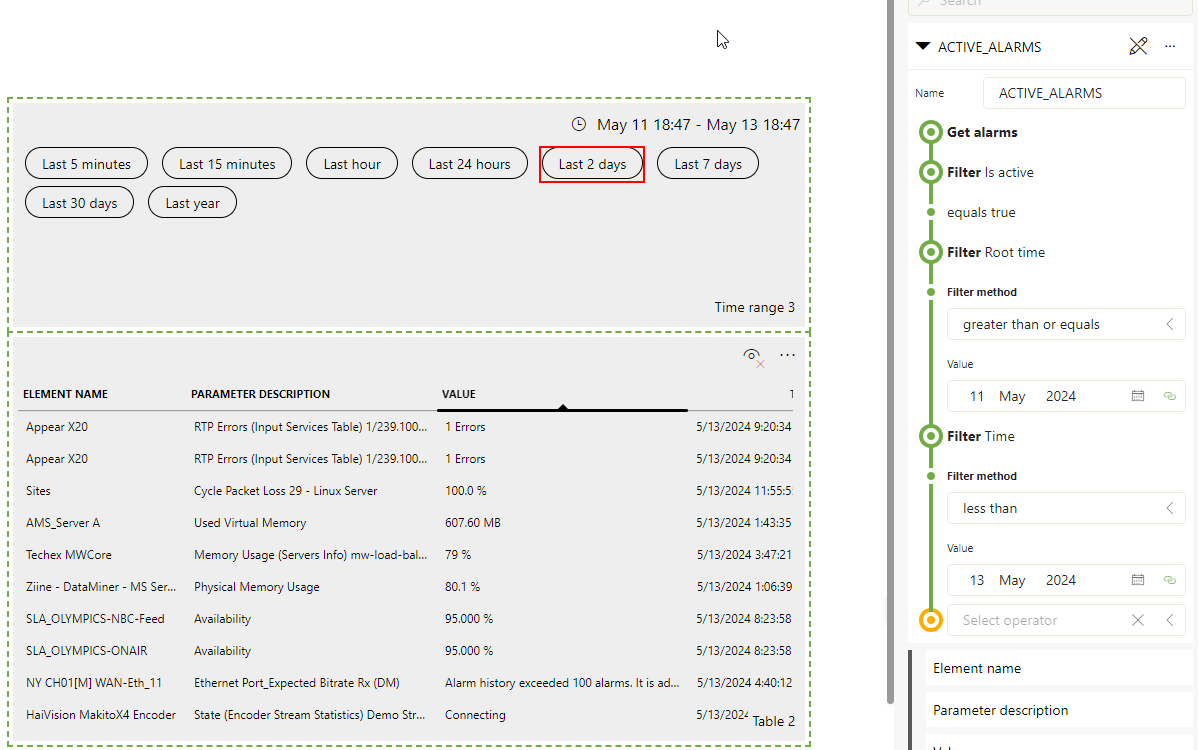
A possible option is using a GQI query in a dashboard that displays only the active alarms:

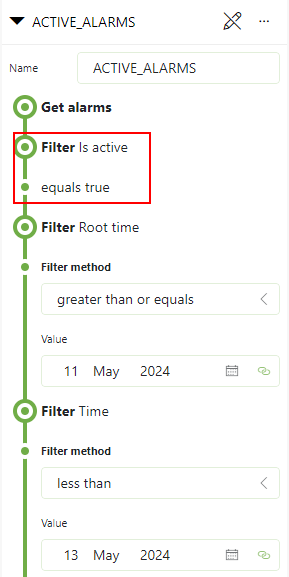
You could use a time range feed as a filter for the query to define a specific timespan (e.g. last 2 days):

Hope it helps.

Simon Nenez [DevOps Advocate] Selected answer as best 27th September 2024
0
Nathan Sciani [DevOps Member]481 Posted 9th January 2025 1 Comment

Is there a way to use the severity duration as above but for the last 30 mins?

We have a use case where our NOC have a filter on UnAcknowledged alarms and wanted to implement a filter based on alarms that have been in the system for more than 30 minutes.  I can’t use that feature as a GQI as above as I would have to continually adjust the start and end time?

Marieke Goethals [SLC] [DevOps Catalyst] Posted new comment 9th January 2025
Marieke Goethals [SLC] [DevOps Catalyst] commented 9th January 2025

Hi Nathan,
Could you create a new question for this? I'm afraid that an answer to an existing, resolved question is very likely to get overlooked by our content experts.

0
Simon Nenez [DevOps Advocate]414 Posted 14th May 2024 2 Comments

Hi Miguel. The TDF Network Operation Center is only based on Cube currently…

I think that in the future we will introduce Dashboards for the NOC to displays statistics. B ut currently it’s not down.

Can we display Dashboards into Cube ?

Marieke Goethals [SLC] [DevOps Catalyst] Posted new comment 26th August 2024
Miguel Obregon [SLC] [DevOps Catalyst] commented 14th May 2024

Hi Simon,
I could not find an option in Cube for your use case.
The closest option could be using sliding window, however the limit for this option is 1 day. More information about this option can be found in DataMiner Docs:
https://docs.dataminer.services/user-guide/Basic_Functionality/Alarms/Working_with_alarms/Working_with_the_Alarm_Console/Applying_alarm_filters_in_the_Alarm_Console.html#manually-applying-an-alarm-filter-in-an-alarm-console-tab
Hope it helps

Marieke Goethals [SLC] [DevOps Catalyst] commented 26th August 2024

It is possible to display a dashboard in DataMiner Cube by embedding it in a Visio drawing. You can also embed an individual component in a Visio drawing. More info here: https://docs.dataminer.services/user-guide/Advanced_Modules/Dashboards_and_Low_Code_Apps/Dashboards_app/Creating_and_configuring_dashboards/Embedding_a_dashboard_component_in_a_webpage_or_Visio_drawing.html and https://docs.dataminer.services/user-guide/Advanced_Modules/Dashboards_and_Low_Code_Apps/Dashboards_app/Tutorials/Embed_Dashboard_in_Visio.html

Please login to be able to comment or post an answer.

My DevOps rank

DevOps Members get more insights on their profile page.

My user earnings

0 Dojo credits

Spend your credits in our swag shop.

0 Reputation points

Boost your reputation, climb the leaderboard.

Promo banner DataMiner DevOps Professiona Program
DataMiner Integration Studio (DIS)
Empower Katas
Privacy Policy • Terms & Conditions • Contact

© 2025 Skyline Communications. All rights reserved.

DOJO Q&A widget

Can't find what you need?

? Explore the Q&A DataMiner Docs