I'd like to repeat a few components like a 'state' block and a parameter trending 'line chart' for each element in a specific View with a specific Protocol.
I believe I should use GQI in combination with Group block, but I'm lost.
Anyone who has done something similar already?
Hi Jeroen,
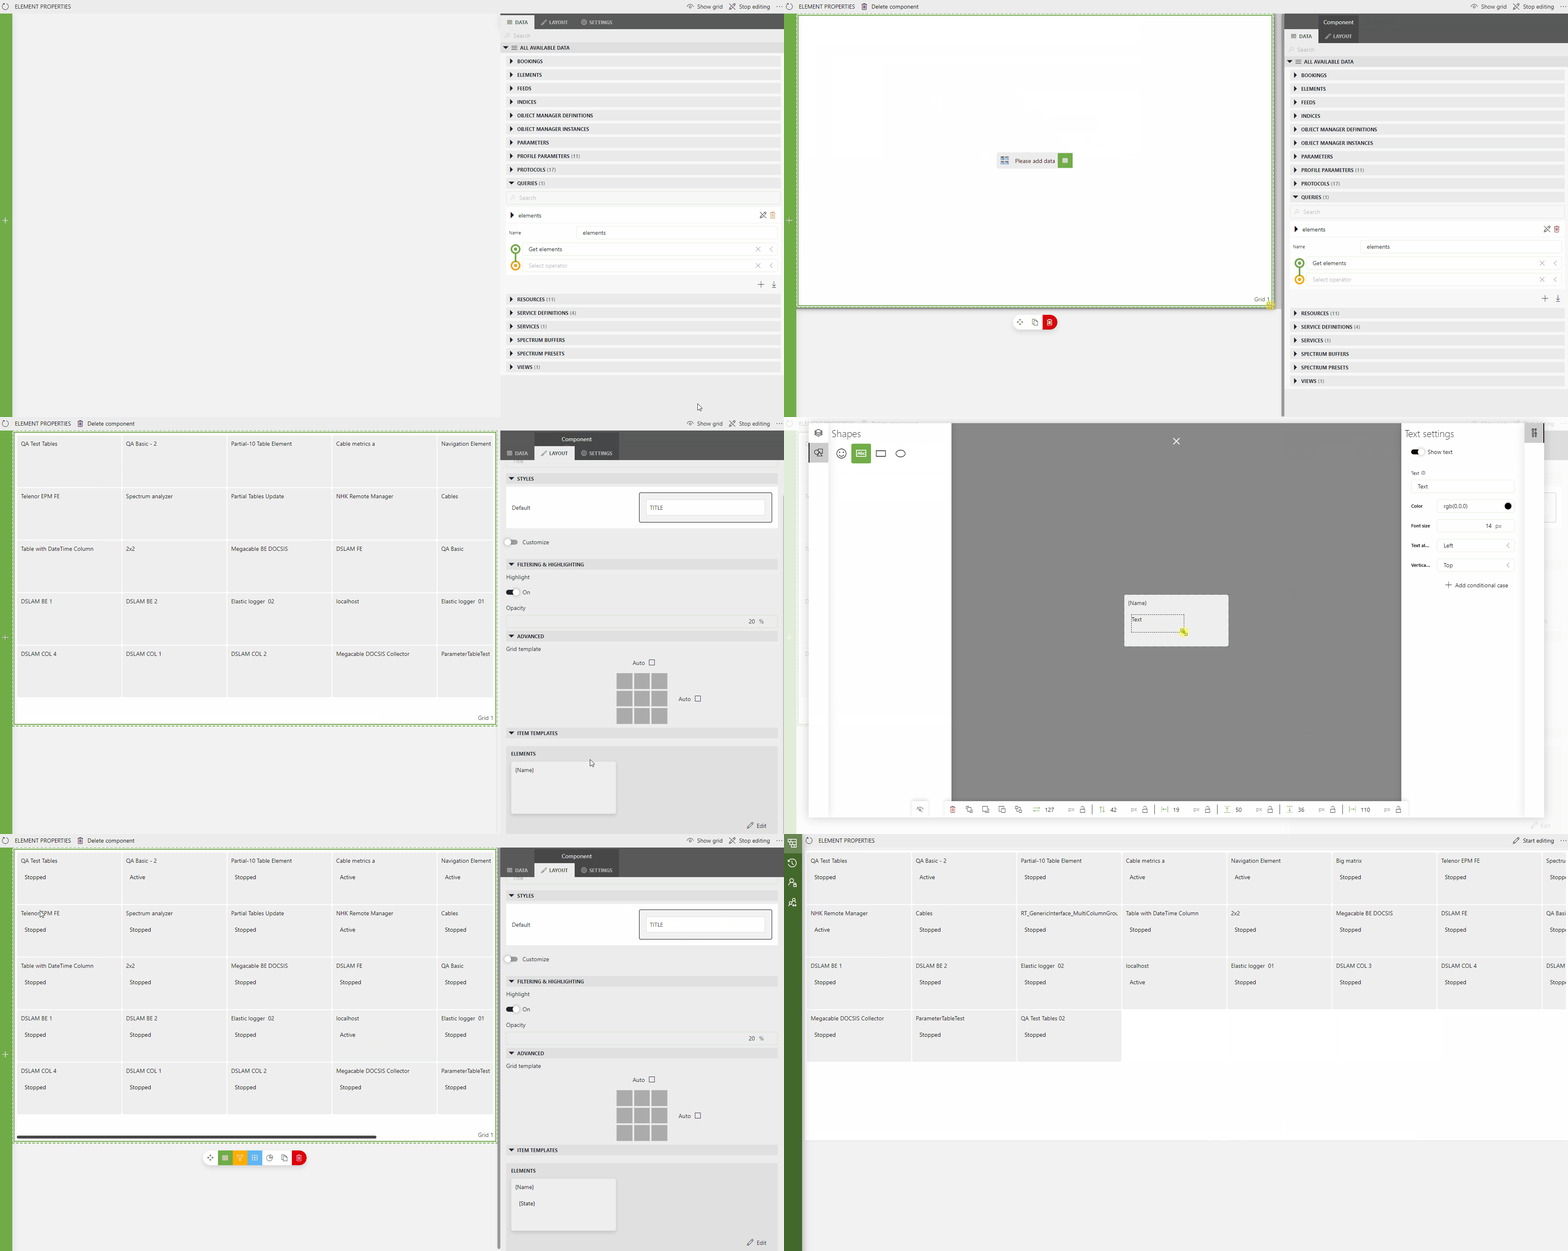
This sounds like a use-case for the grid component. This component lets you draw something for every row of your GQI query result. (Main released in 10.3.0 and Feature release in 10.2.12) The component is still behind the ReportsAndDashboardsDynamicVisuals softlaunchflag.
Currently it is only possible to render templates for each row of your query result. There is an item on our backlog to support other visualizations as well. (https://collaboration.dataminer.services/task/201814)

With the template builder you can also add icons, shapes, colors… to your template. These items can even be rendered conditionally. E.g. give the shape a red color when the element state is “Stopped”. In low-code apps you can also execute actions on click of a certain template/shape/icon…
It would indeed be the ultimate goal to render existing visualizations (e.g. line chart) within a block of the grid. But we are not there yet 🙂
This looks promising indeed.
So currently it’s mostly text from what I see in your demo, but in the end it’s also going to be possible to show for example line charts for each of the elements?