Hello All,
I have historically used the native query builder on dashboards to build a table listing basic windows server metrics from the Microsoft platform protocol. Once built, I have been able to connect the selected table rows to line charts to display trending for parameters like Total Processor Load.
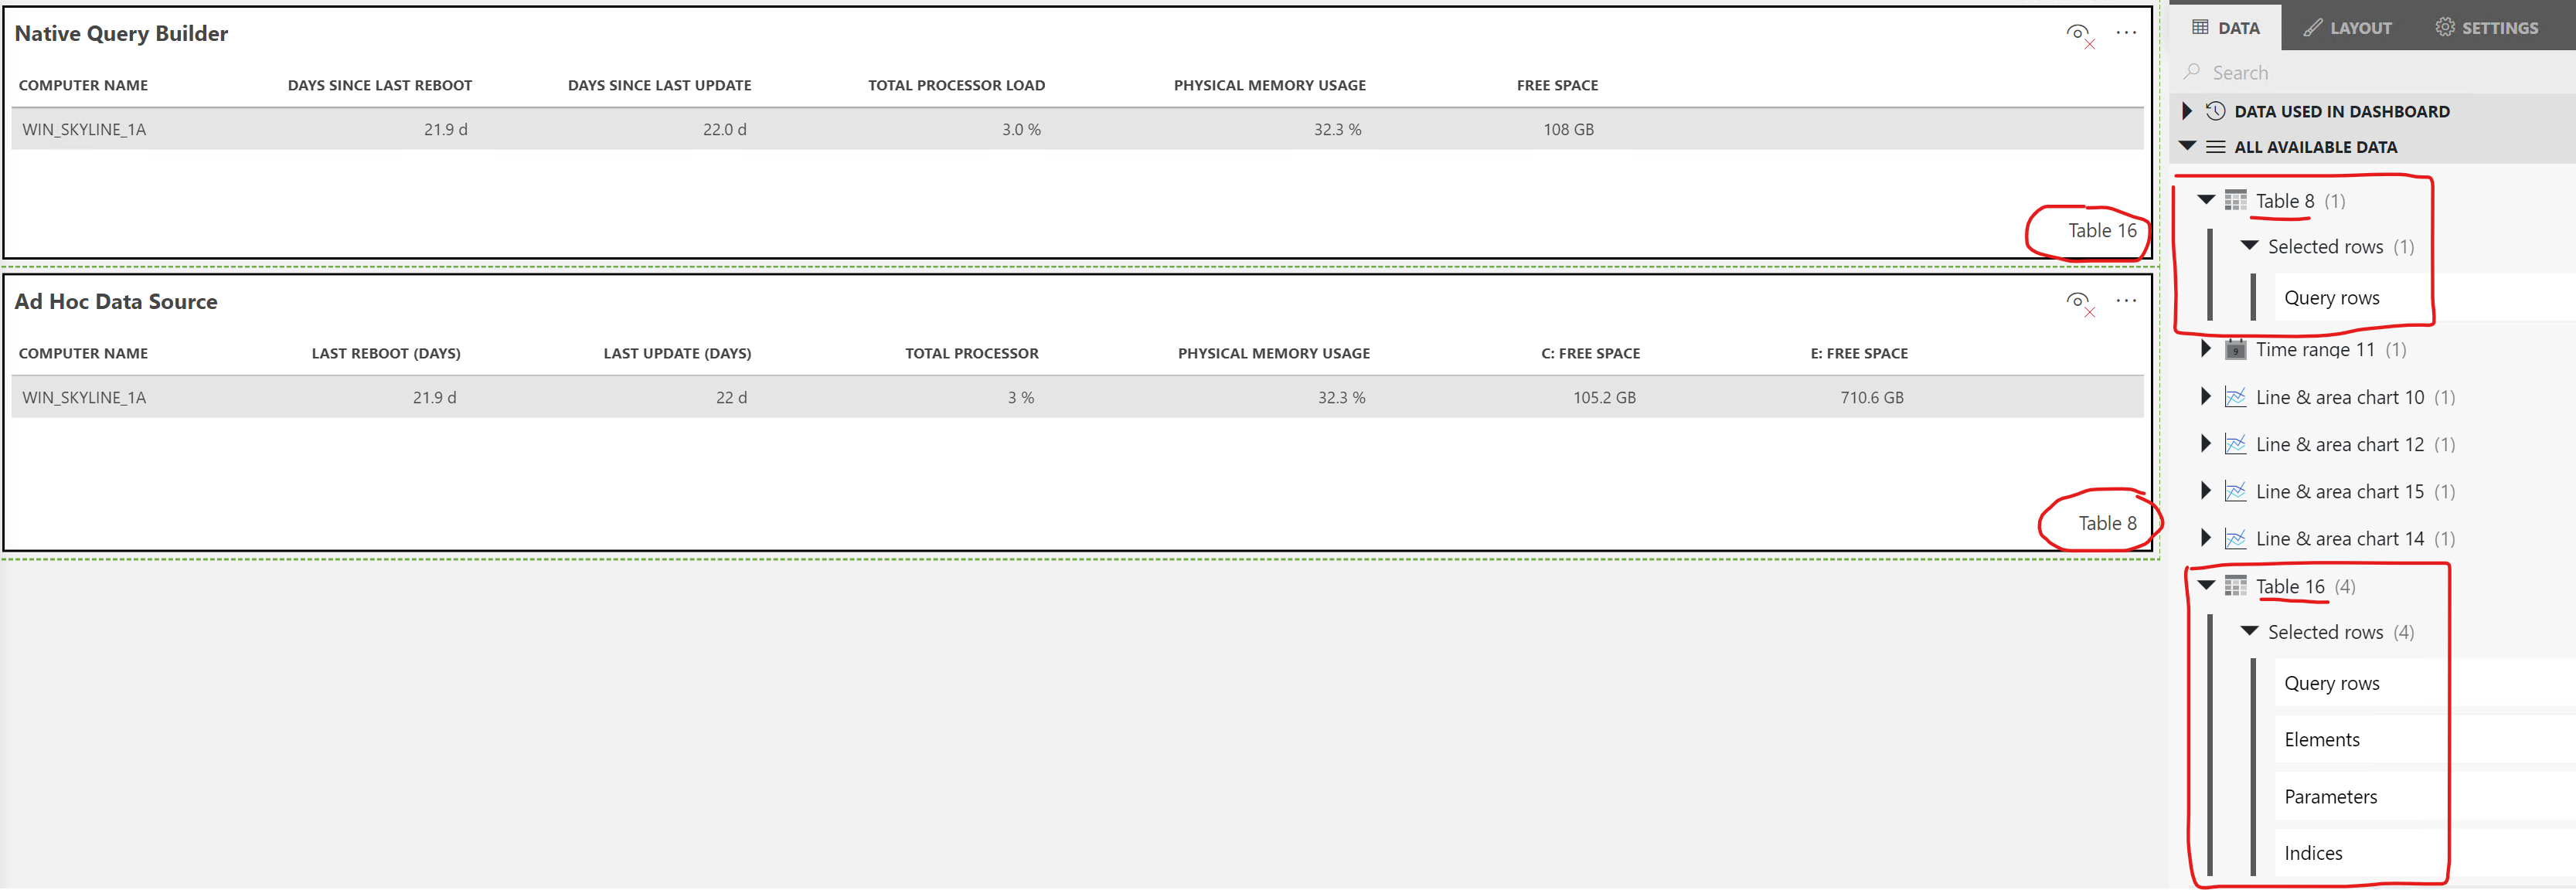
Recently, we have tested migrating this same exact query from the native web builder to an ad hoc data source script. After migration, I found that I am no longer able to connect the selected rows to line charts. “Elements” and “Indices” are missing from the available filters under the table feed. This can be seen in the picture below:

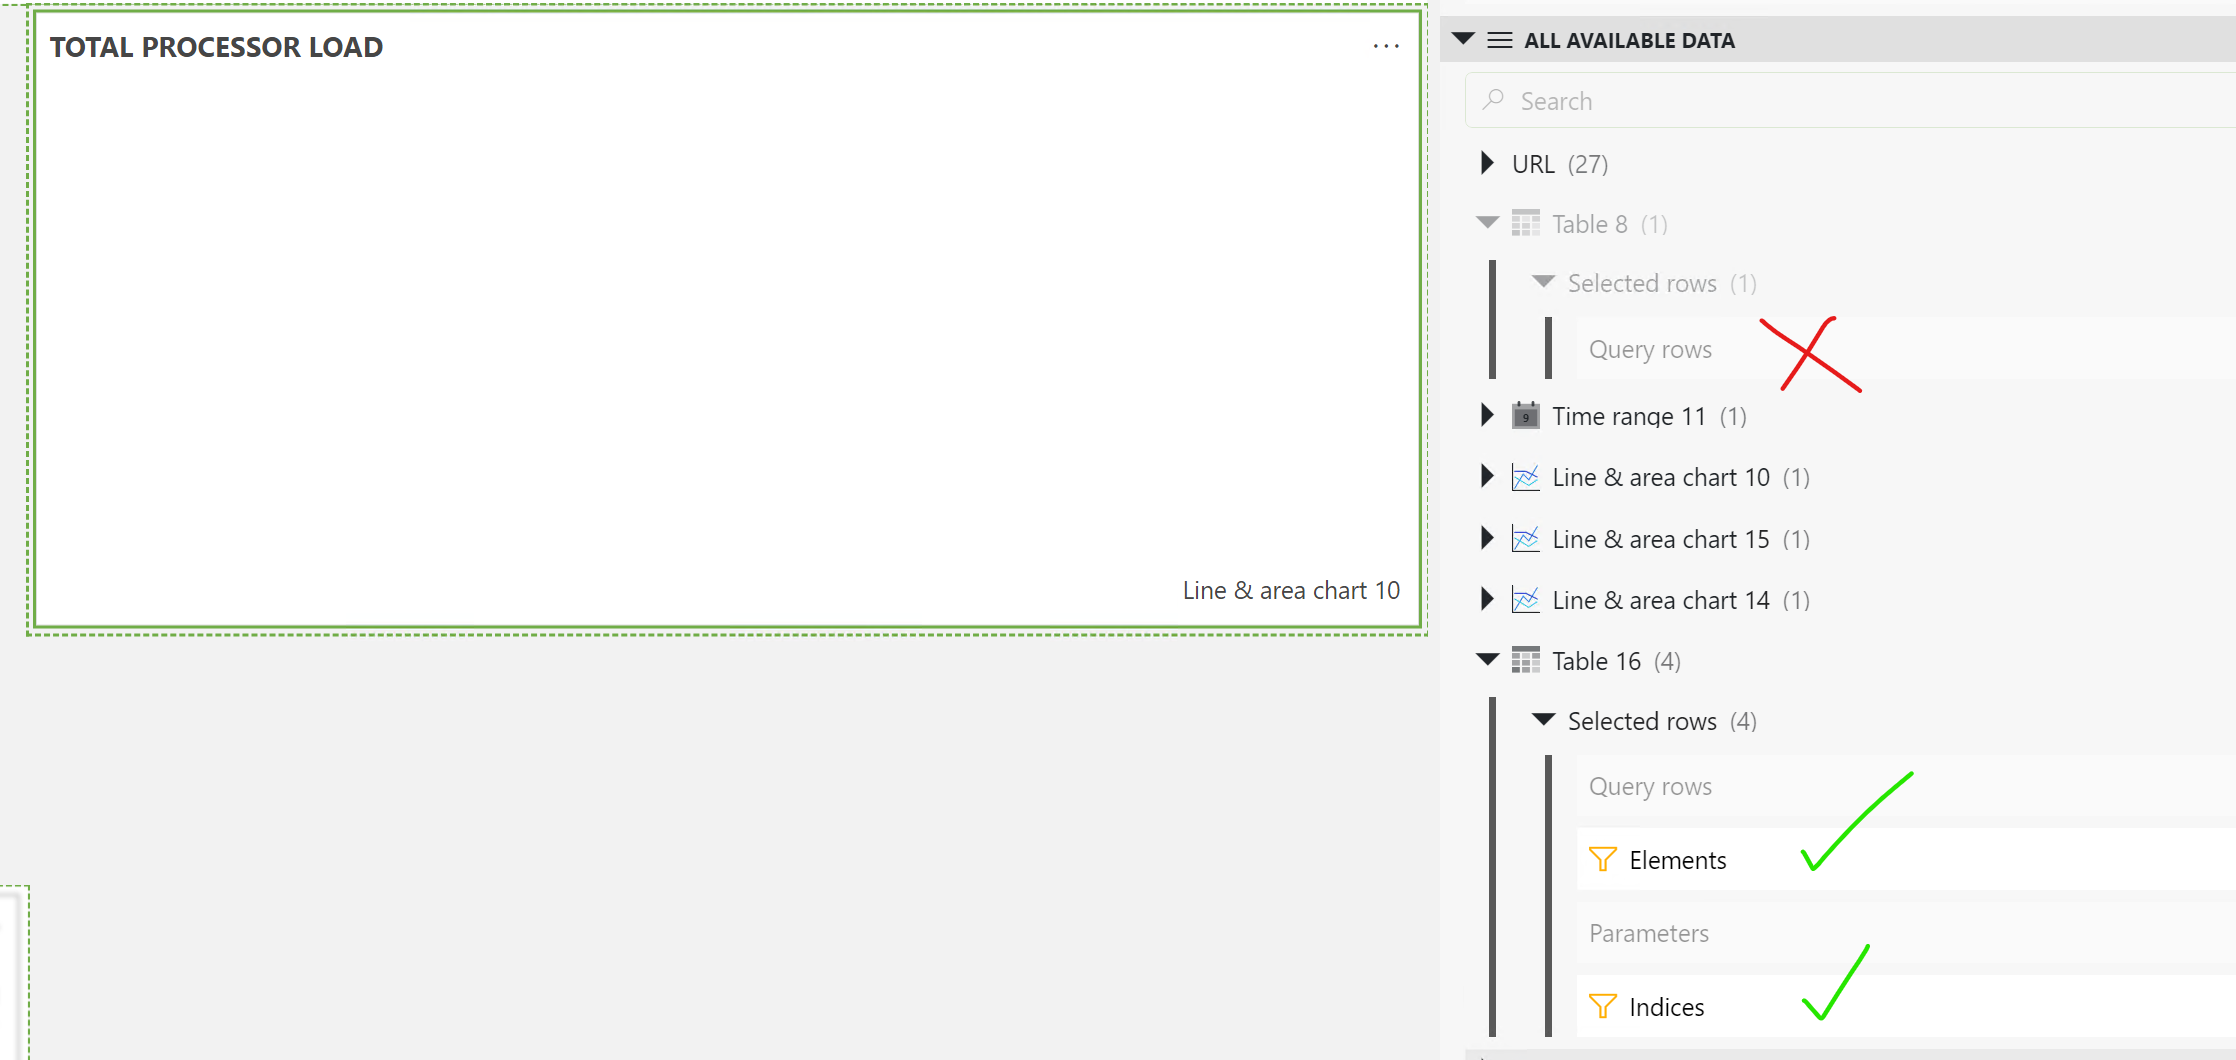
The next picture shows that the single “Query rows” filter cannot be used to feed a line chart component.

Are there changes or additions that we can make to the ad hoc data source script to allow it to feed a line chart?
Thank you in advance.
Hi Thomas,
Built-in sources have metadata included that are being used for feeding. In 10.4.1, Ad hoc data also supports metadata see: Linking rows to DataMiner objects | DataMiner Docs
I believe that is what you will need to add to your ad hoc source as well in order to get feeds again with your row selection. Hope that helps.
Hi Pieter, Thank you for the recommendation. We will give this a shot.