Hi ALL.
Why can't I display TRENDS for querying the table but for taken for the parameter table, I can ?
Is there anything I can change in the settings to do this?
The screen from QUERIES to Service table

The screen from table parameters SERVICE as below:

Where could the problem be?
Big tahnks for help.
Br.
Jarek
Marieke Goethals [SLC] [DevOps Catalyst] Selected answer as best
Hi Jarek,
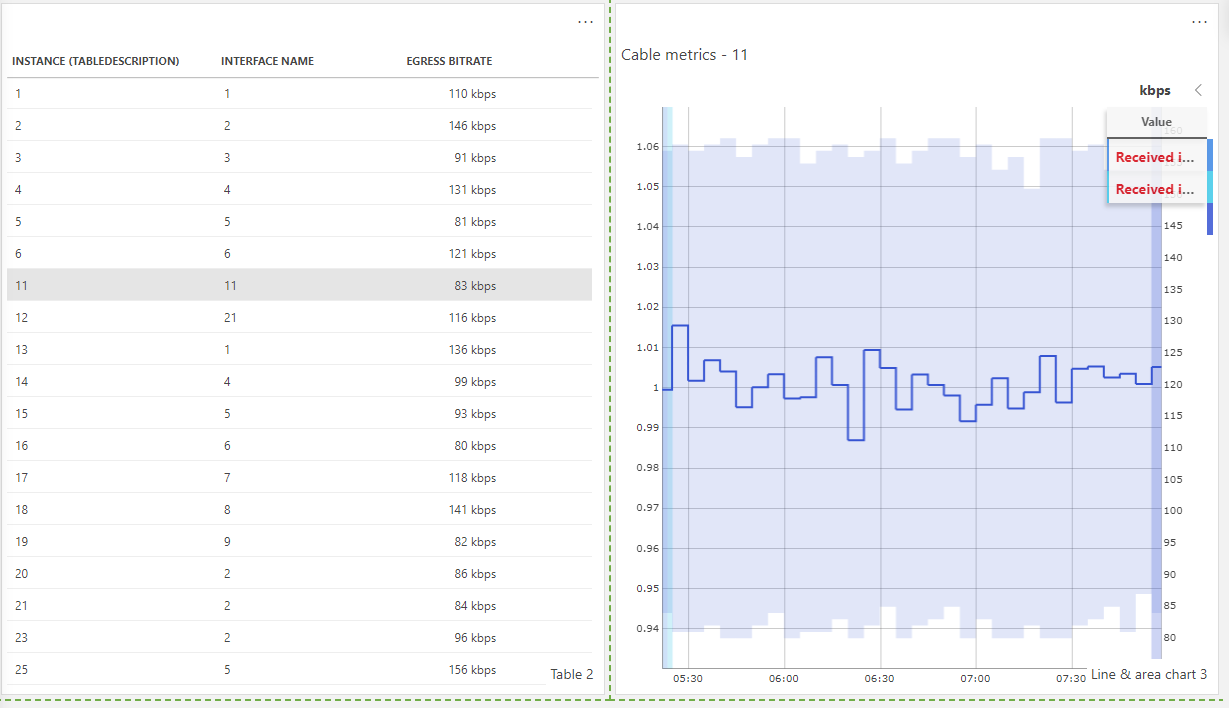
As Robin suggests you can feed the parameter of the selected row to a line chart:
- Add a line & area chart to your dashboard
- Select a row in your table
- Go to FEEDS and select your table
- Drag Parameters on the Line & Area chart
The end result will look something like this:

Hope this helps!
Best regards, Ward
Marieke Goethals [SLC] [DevOps Catalyst] Selected answer as best
If you are working in a low code app, you could also try to use on click actions to, for example, navigate to the monitoring app on click of a table cell. More info on further styling and adding additional functionality to your table can be found here:
https://docs.dataminer.services/user-guide/Advanced_Modules/Dashboards_and_Low_Code_Apps/Low_Code_Apps/Tutorials/Tutorial_Apps_Style_A_Table.html