Hi,
In the screenshot below if I click on one row the valuers on gauge should be shown below but it shows as Not Initialised but the alarm template colour is taken appropriately. How can the values be also taken 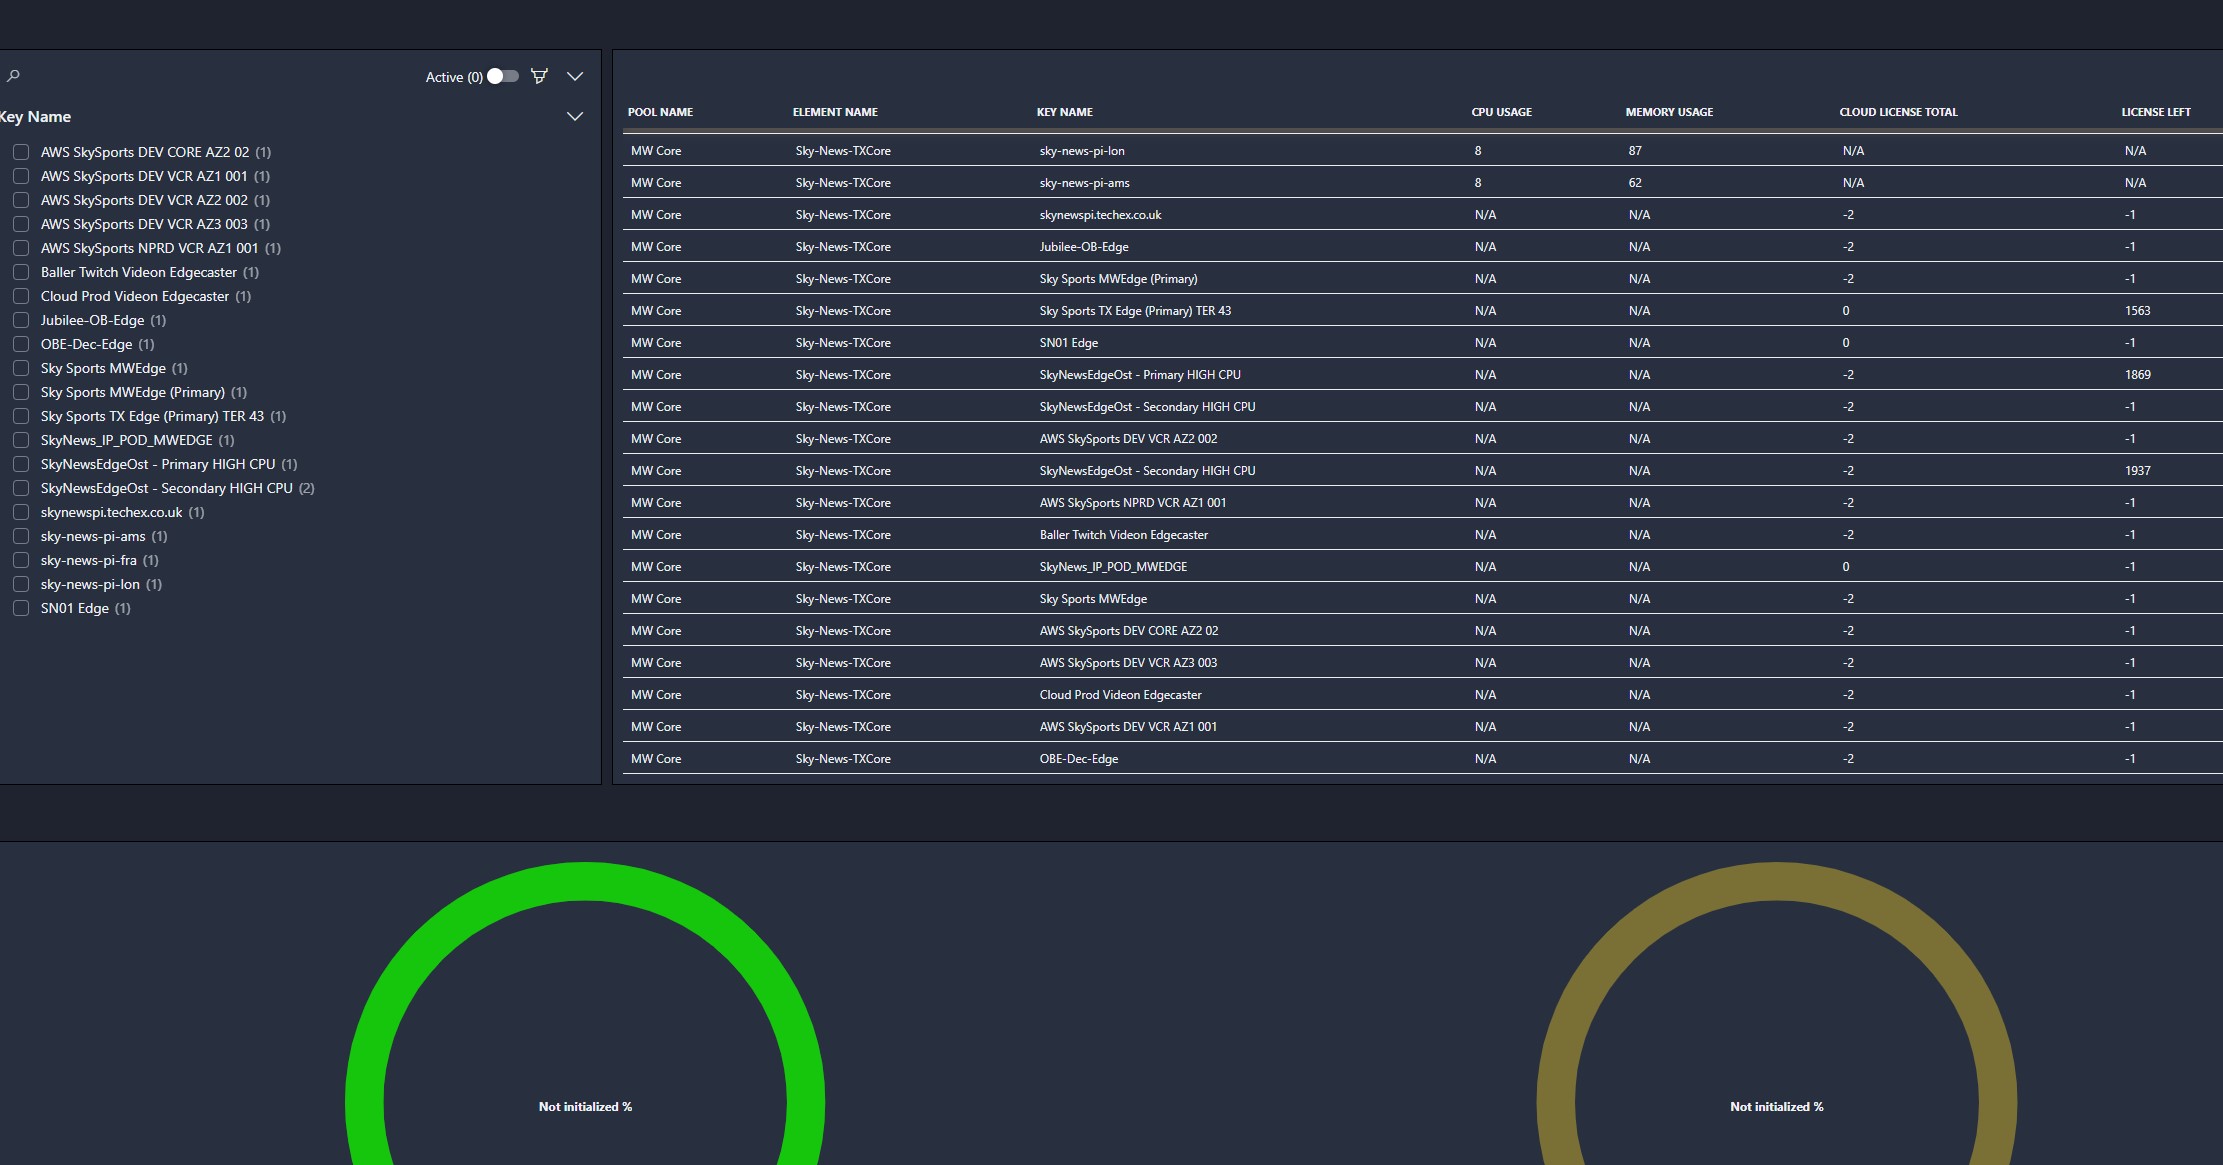
Hi Apurva,
If the parameters that are visualized as Gauge components do not show a value when they actually have one, then you have probably encountered a software issue. You can contact tech support (techsupport@skyline.be) so we can look into this further.
They do show a value, but not the same value as in the table. That is why we suspect that this is a software issue
Hi I think I am getting mistaken in explaining my issue, I will reiterate
The connector or driver works fine there is no shows it shows value in cube as well as in my table
I ahve made this page to show the values for selected ones forget about N/A as this is for other drivers,
So like for CPU Usage there is value and I have configured it if you click it should show that gauge but with the value here in gauge which is actually coming from element and we can see in table, so just value is not showing in gauge but alarm template colour comes that means it knows the value but some setting issue due to which gauge value is not shown
Hi Apurva, I think I understand the issue you are having. The Alarm state value & color are not computed in the web app itself. Instead, these are requested from the DMA together with the (display) value. This means that even though the alarm state is correct, the app may not know the correct value of the underlying parameter. Because of this mismatch, we would like to investigate your setup further
Hi I can see the values which are not in percentage in protocol that shows up like PID bitrate in Mbps but not the one in percentage, is there any issue in setup of gauge on LCA?
No it shows the value i am saying that on the row I click it has values, so why it doesn't shows in gauge although alarm templates colour come up but the value comes as not initiated