Hello Team Skyline,
We want to know if there is a way to view automatically multiple graphs when we click a parameter in a Table like the following image:
The goal is view the 4 graphs when we click the parameter in a table or using the trend groups.
Best,
Hi Ricaurte,
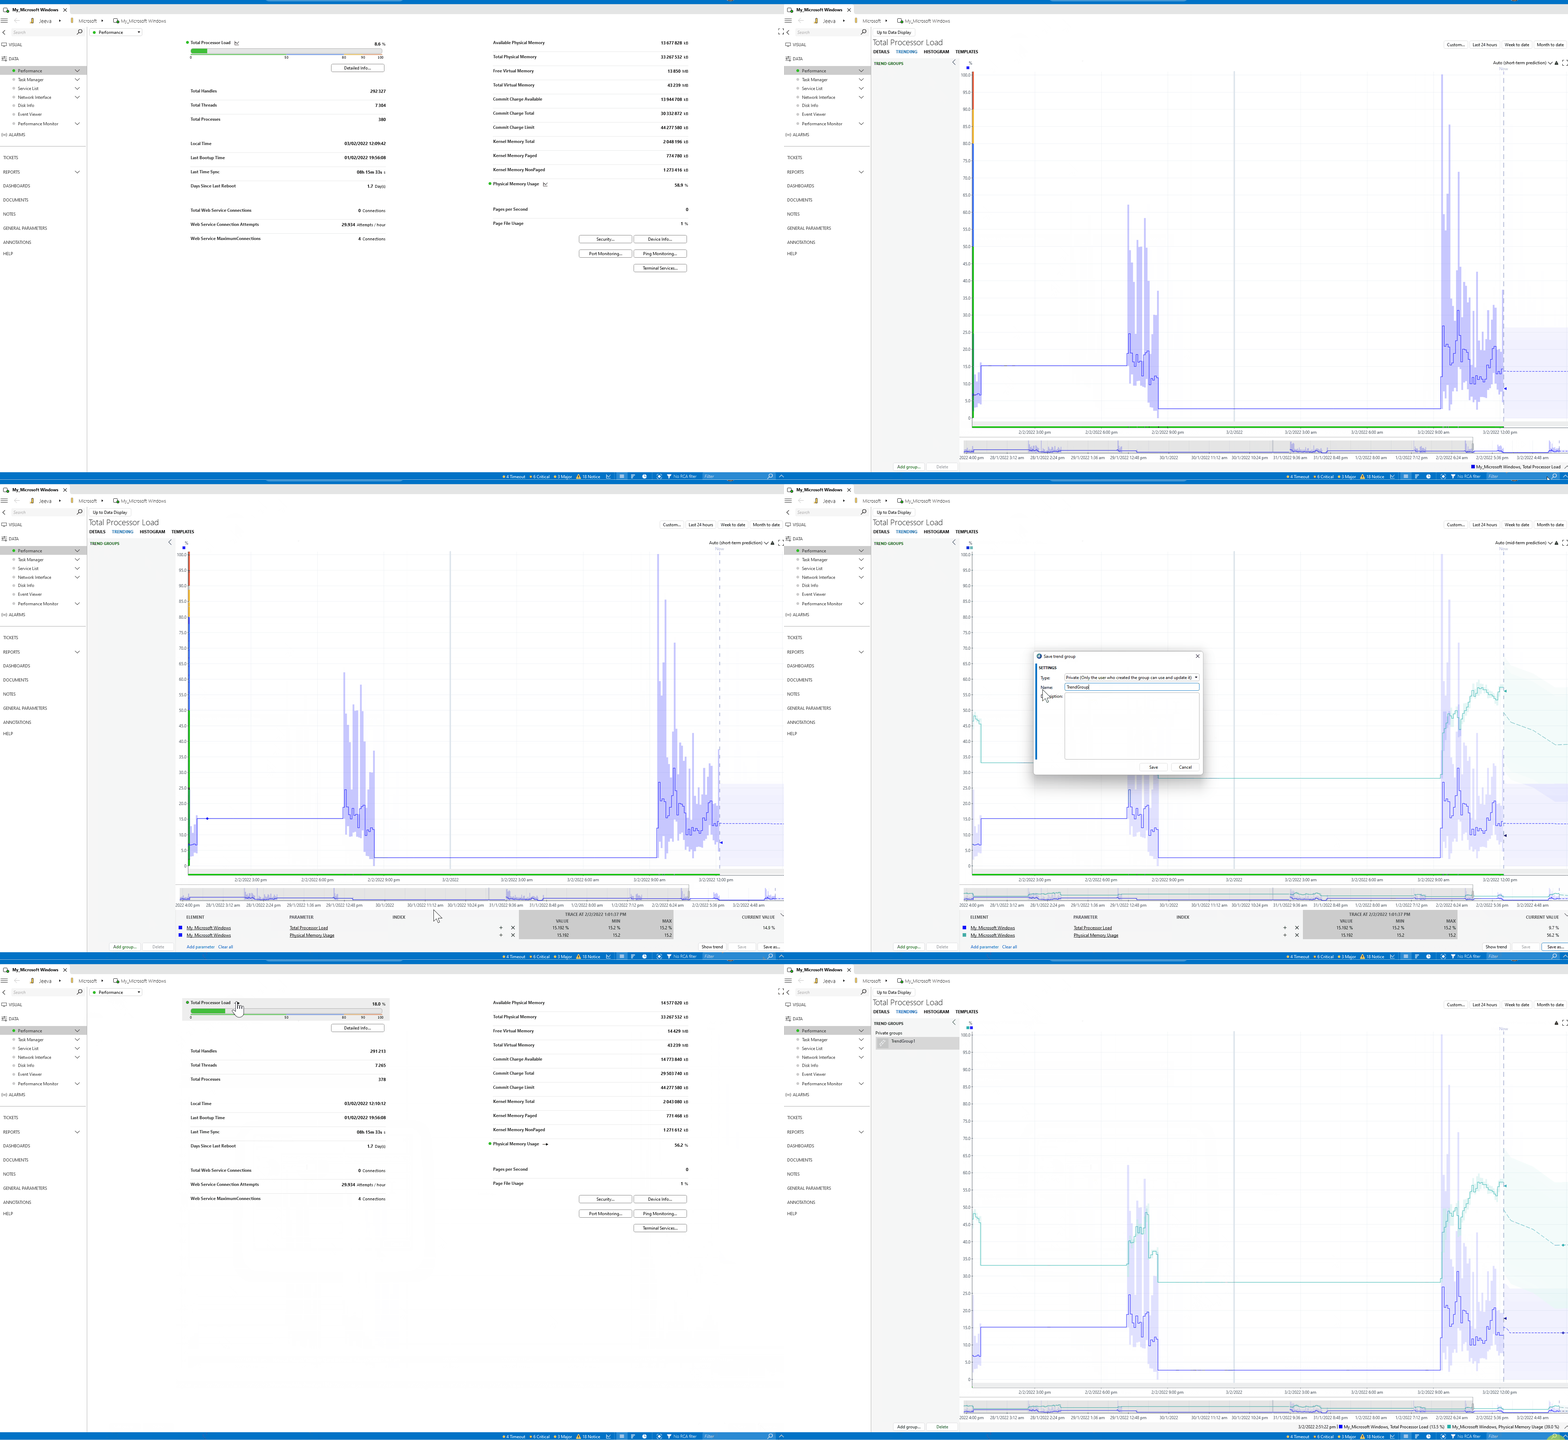
For this, you can create a Trend Group. In the Trend Group, you can save a group of parameters that were saved in the bottom pane (in your case, four parameters). Once you have grouped and saved it, you can access easily it via the left-hand side pane.
Please refer the GIF below:

You may also refer more to this DataMiner Help Link:
https://help.dataminer.services/dataminer/DataMinerUserGuide/part_2/trending/Working_with_the_trend_groups_pane.htm?rhhlterm=trend%20group&rhsyns=%20
Thanks for the info