Good morning,
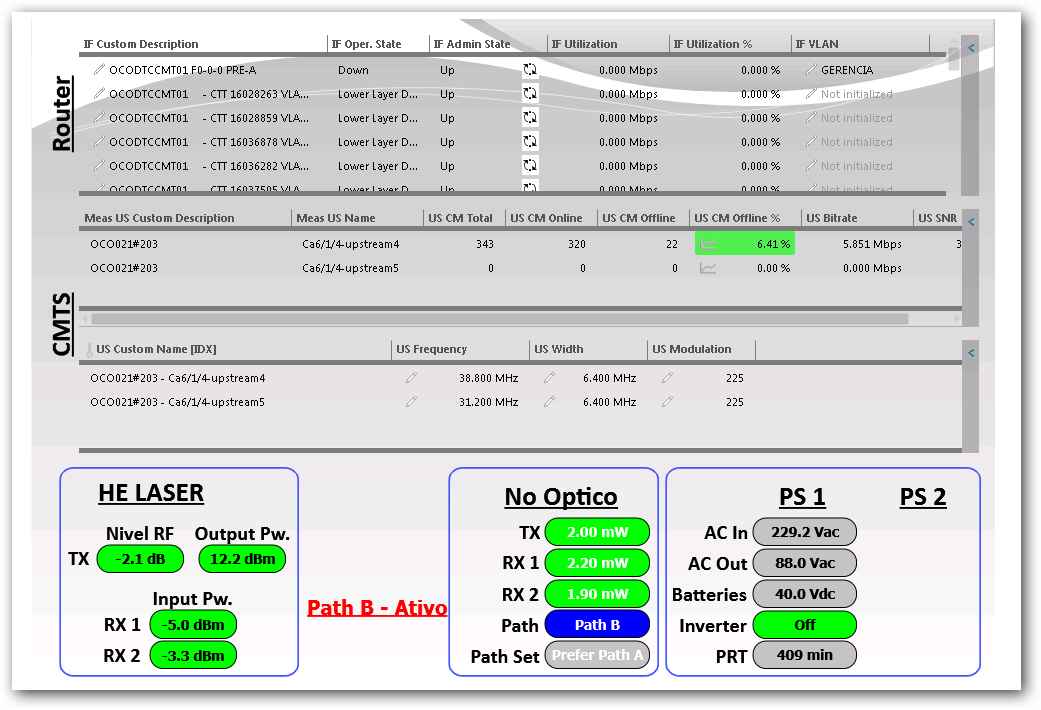
At the operation level, we need to make a view or Dashboard for equipment in the HFC network, the monitoring view must contain at least the Fiber Node equipment, the power supply of the Node, UCER% and the SNR value, do you have any idea or recomendation for this? The view need to have at least 300 elements / interfaces.
Regards
Good Afternoon Ben,
We need all that information at once.
Regards
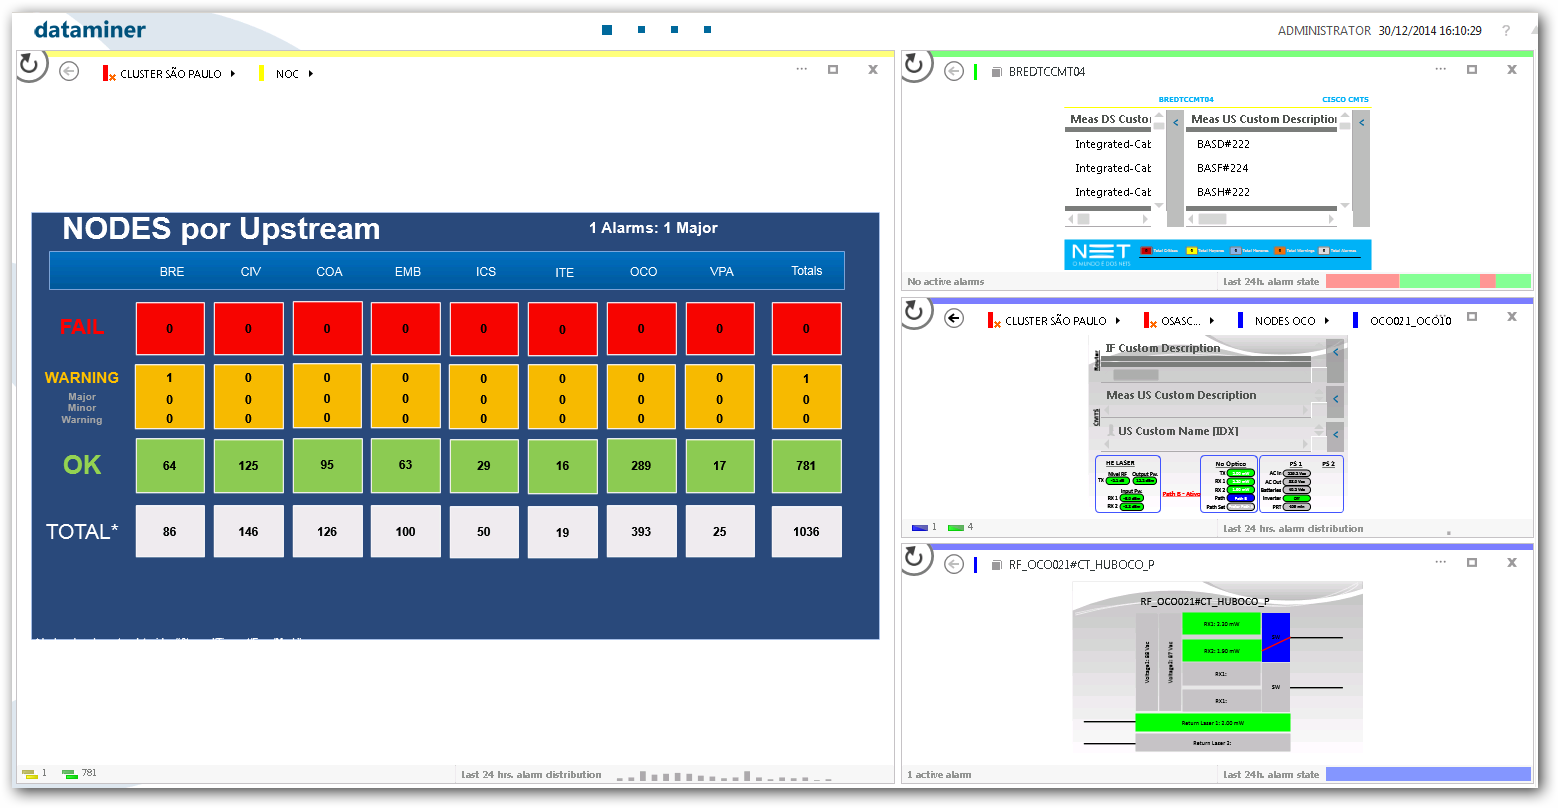
Javier - Here is an idea implemented by other HFC Operators.
A. Create a service per node containing (Ethernet feeds to CMTS, CMTS US & DS carriers, HE Lasers, Optical Node & PSs feeding such node);
B. Each "Node Service" becomes an element that can be aggregated per HUB or Region;
C. You will be able to have both views & dashboards, for operations, NOC, SOC, maintenance, call-center & Management;
D. Track "Node Performance" and SLA;
Hi Roger,
Thanks for the info, let me check with my group.
Regards
Javier – I’ll be glad to show the concept to the group.
Hi Javier, are you talking about making a single dashboard that gives you all that information at once, or a dashboard that gives you the information for one selected fiber node along with the associated power supply?