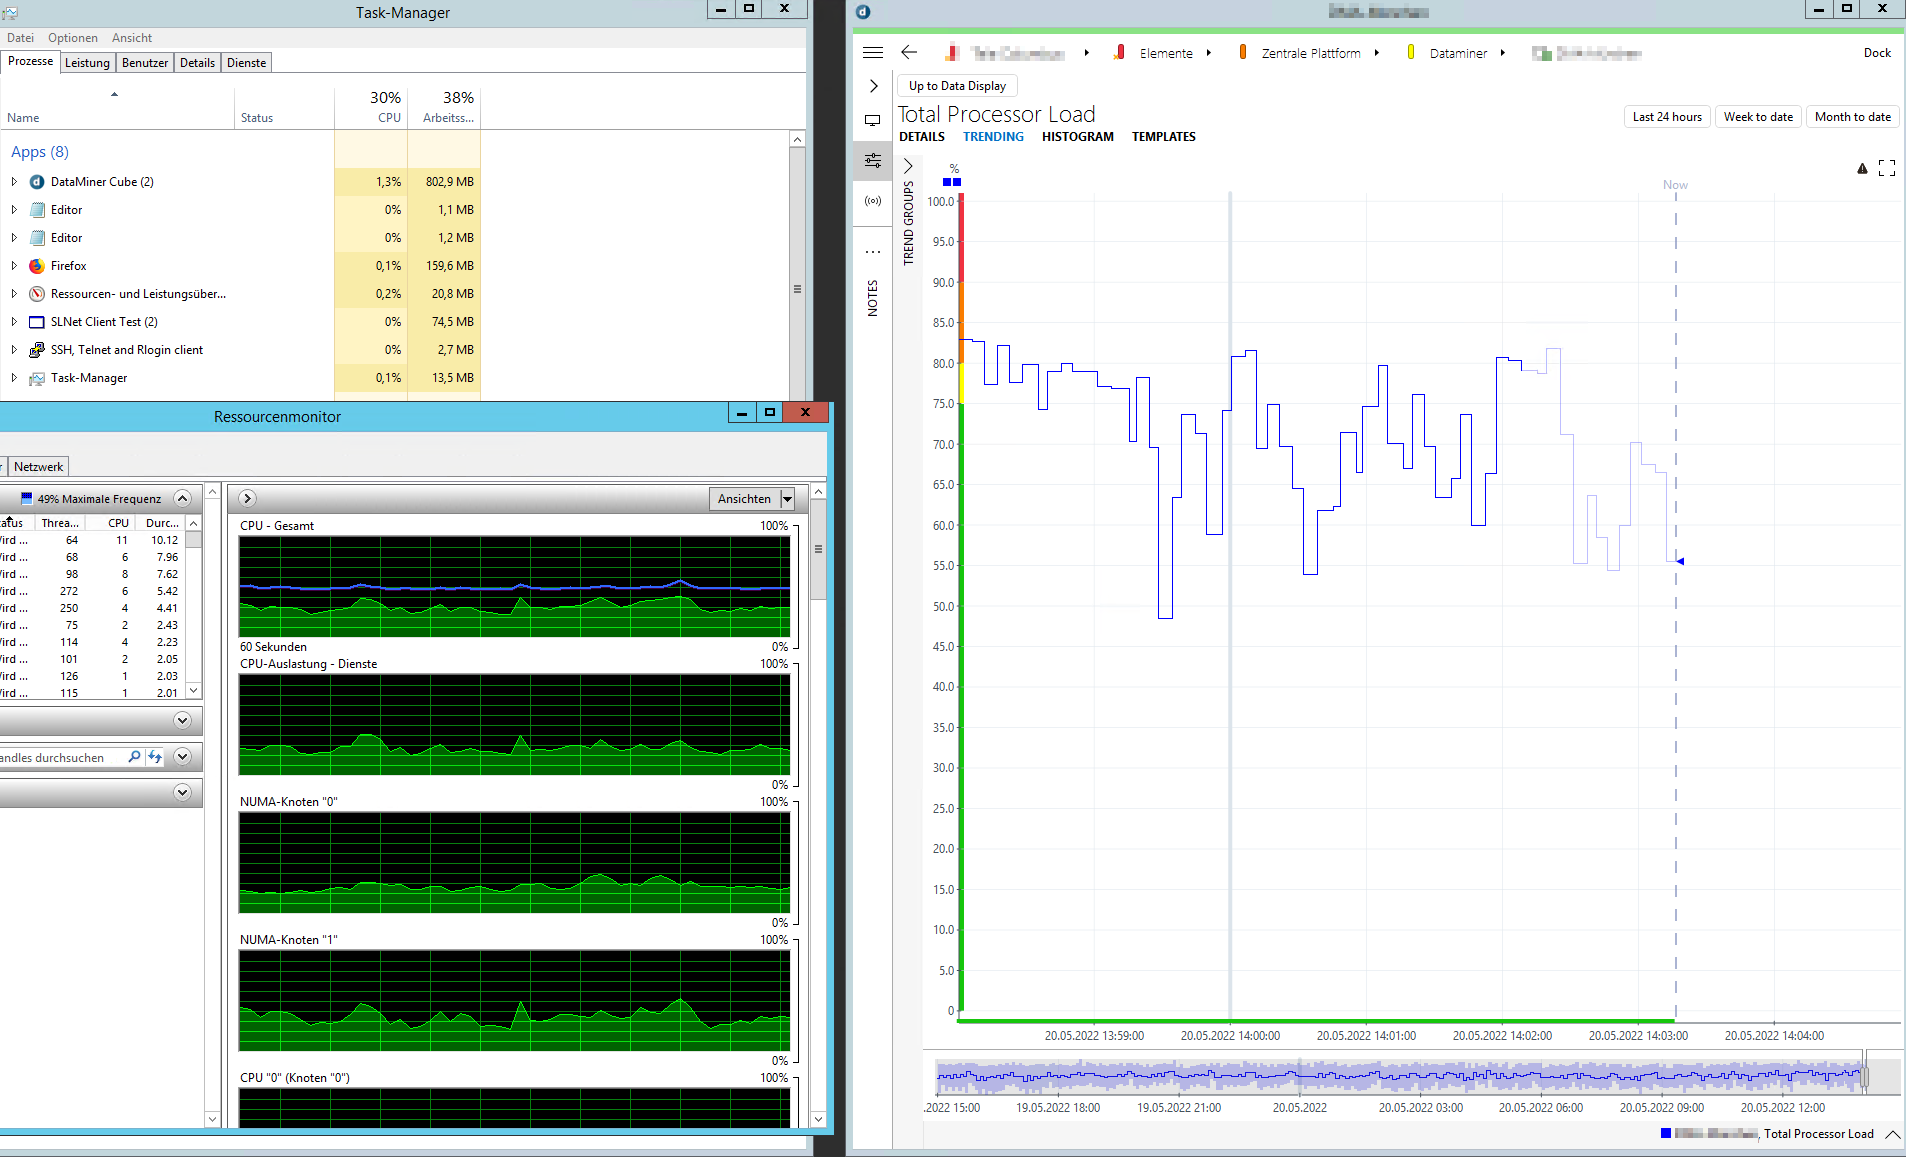
There’s a noticable differen in the cpu load reported in the Microsoft Platform connector and the load reported in Microsoft Task Manager.
What can cause this discrepancy?

The original reason for choosing that specific call might be lost to time, as this was one of the first connectors ever developed. But I make a couple of guesses from some quick research:
From: https://social.technet.microsoft.com/Forums/en-US/0435e7c5-3cda-41a0-953e-7fa462fde03b/perfmon-process-processor-time-vs-task-manager8217s-cpu-usage-for-monitoring-a-specific?forum=perfmon
The 3rd response is from Microsoft
Looks like TaskManager uses the NtQuerySystemInformation call internally.
Something I’m not sure we cannot duplicate because it’s a pinvoke call to your local OS. Not over a network I believe.
There’s actually a number of ways the CPU utilization gets calculated even within windows itself. WMI has it’s own Performance Counter Classes that get created at system initialization. You could compare it to the Performance Monitor instead of the TaskManager. It’s possible the WMI grabs data from there.
Maybe one of those other calls matches closer with the taskmanager. But we should also be careful in trusting the taskmanager CPU usage.
A quick google found a few people did deeper research: https://aaron-margosis.medium.com/task-managers-cpu-numbers-are-all-but-meaningless-2d165b421e43
As a result, because dynamically-adjustable processors automatically enter an enhanced mode when under load, Task Manager’s CPU % for a process that is actively executing code will generally be significantly larger than its processor time. But because that number is placed on a scale that is capped at 100%, Task Manager makes it appear that the process is taking up more of the system’s computing capacity than it actually is. For a while, Task Manager itself would report overall CPU usage greater than 100%. Because that’s counterintuitive even to people who understand the concept of “utility,” Task Manager now caps the numbers it reports at 100%. That ends up further distorting what it reports.
Thanks for the explanation.
I’m using the Resource Manager indeed.
Still I’m surprised that the Task Manager behaves the way the article explains.
I compared some of the wmi commands I found online.
The command being executed by the connector is:
SELECT PercentProcessorPerformance FROM Win32_PerfFormattedData_Counters_ProcessorInformation WHERE NAME = “_TOTAL”
This results in a a value 112 or 113, which doesn’t match the real value at all.
I tried some other commands, and all of them provide correct values.
I don’t know if there is technically a difference between these commands and which one should be the preferred command.
select percentprocessortime from win32_perfformatteddata_perfos_processor where name = “_total”
select loadpercentage from win32_processor
select loadpercentage from CIM_Processor
What was the reason to go for that first command instead of the other 3?