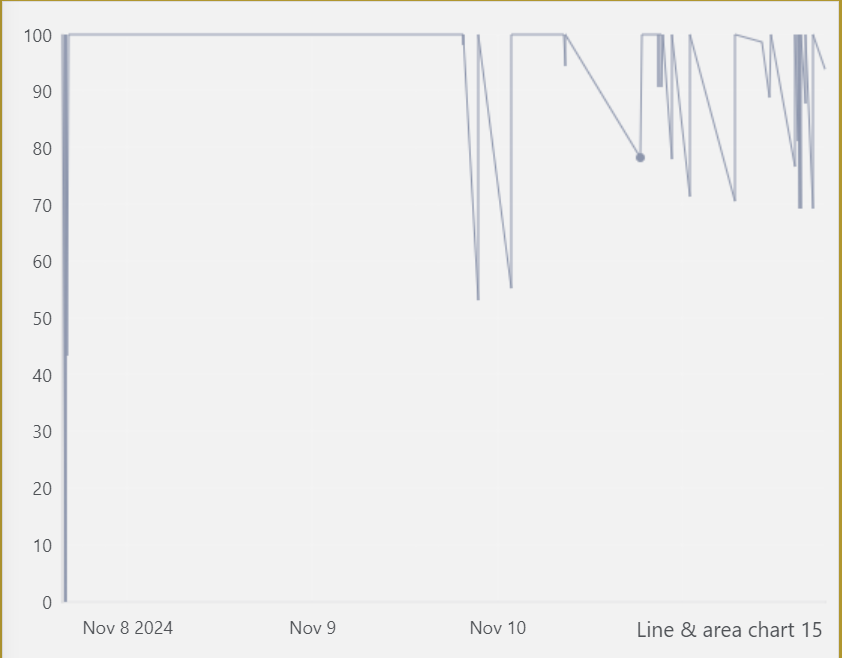
hello im using a Low Code App to create a new dashboard using query to create line graph, for numeric compoenents works ok but for discrest it didnt work.
there is somethink wrong or the query can’t work with the graph?
Hi Juan
The line chart using GQI queries is not designed to work with discrete values but can work with them as long as their underlying value is a number. In your first screenshot it seems to be working as expected. The values for the X-axis are coming from the time column and the values for the Y-axis are coming from the ‘State Fuentes XM3…) numeric column. Note that the axis labels will not correspond to the display labels, but with the numeric values of the discrete.
Hi Juan
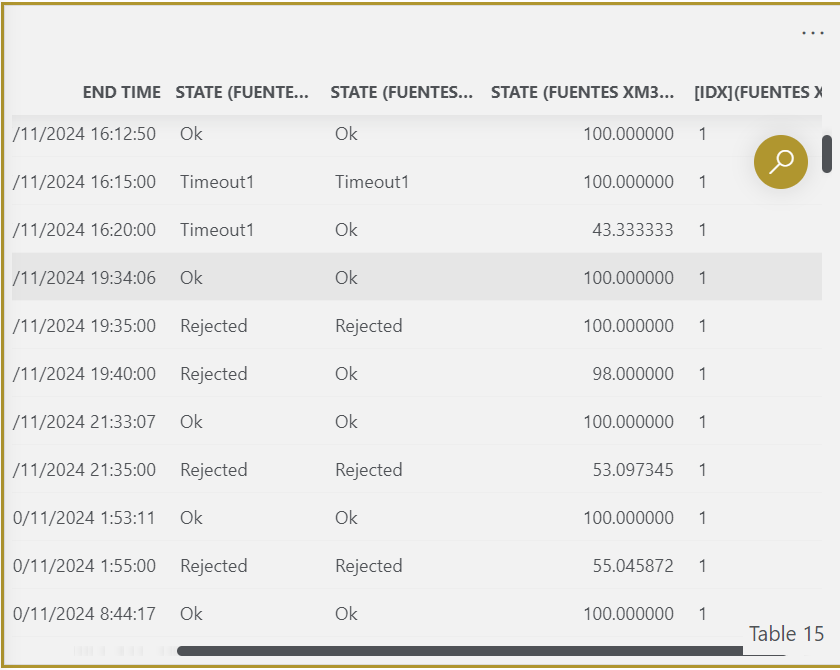
In your example, the values on the line are indeed ranging from 0-100. This is because the values are coming from the 'State Fuentes XM3…' column, which probably corresponds to the '% active longest'. The actual discrete values are in a different column of the table. You can change what column values to use for the axis in the layout settings of the component. (see docs: https://docs.dataminer.services/user-guide/Advanced_Modules/Dashboards_and_Low_Code_Apps/Visualizations/Available_visualizations/Charts/Line_and_area_chart.html?q=line++a&tabs=tabid-1#configuration-with-query-data-feed)
Hi Wout
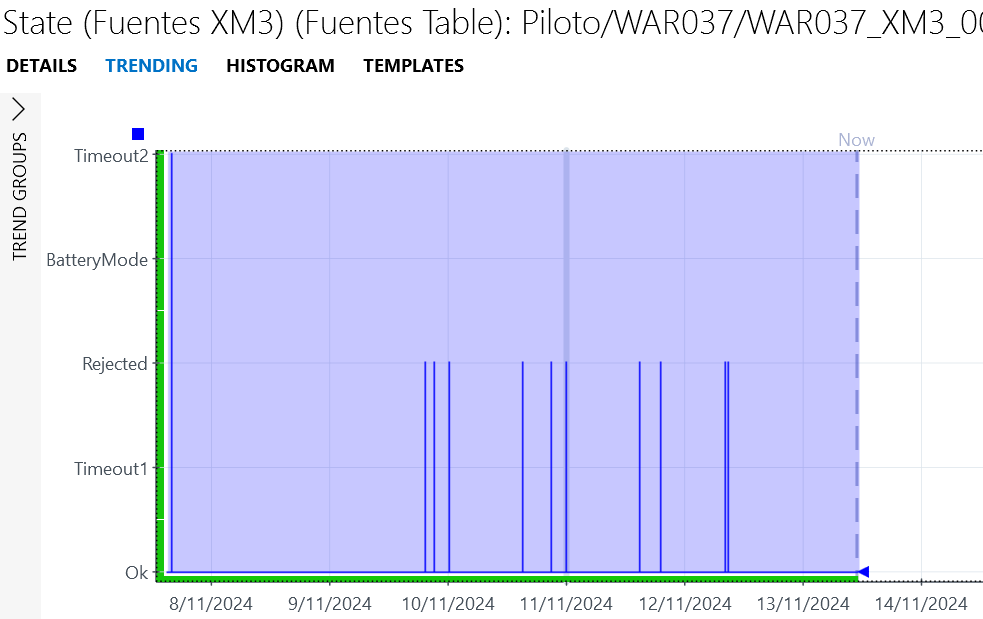
the values discrets are numeric form 1 to 5, but the values are line %, in the select show this 3 valies:
– ocurred most
– active lonqest
– % active lonqest
my parameter have this setup
<Measurement>
<Type>discreet</Type>
<Discreets>
<Discreet>
<Display>Ok</Display>
<Value>1</Value>
</Discreet>
<Discreet>
<Display>Timeout1</Display>
<Value>2</Value>
</Discreet>
<Discreet>
<Display>Rejected</Display>
<Value>3</Value>
</Discreet>
<Discreet>
<Display>BatteryMode</Display>
<Value>4</Value>
</Discreet>
<Discreet>
<Display>Timeout2</Display>
<Value>5</Value>
</Discreet>
</Discreets>
</Measurement>
thanks