Hello,
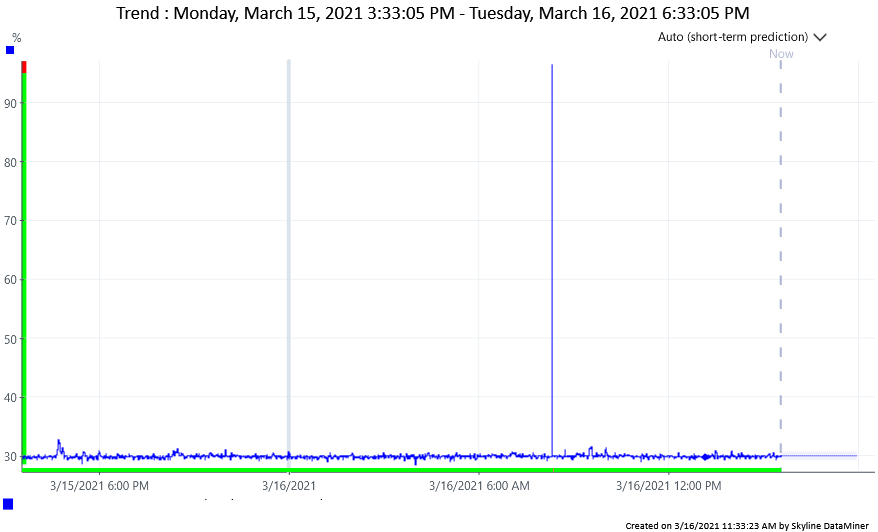
I am monitoring a VM with Linux Platform SNMP driver v 1.1.0.34 on a system running Skyline DataMiner (9.5.14.0-7731). We have recently received alerts for Total CPU Usage at 96 %. (alarm threshold 95%). These are spikes less than 2 minutes in time. The cpu monitor on the VM does not correlate and comes no where near 96%. It does show 'spikes' of about 35%. How is there such a discrepancy? 

Thank You in advance,
Craig
Hi Craig,
This looks like a driver issue. In order to further investigate, please could you let us know:
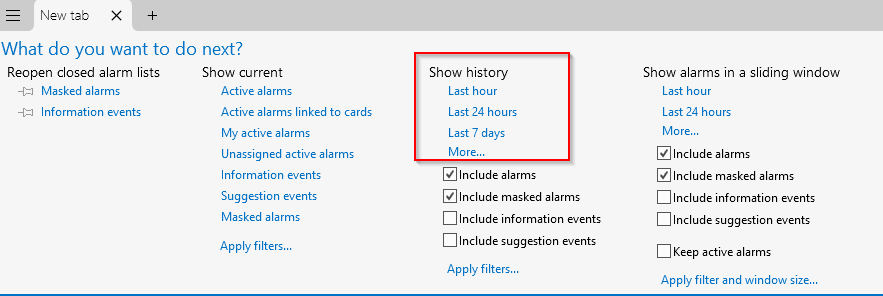
- At the moment of spike, could you check in the alarm history if the element was in timeout? You could check the history by opening a new tab in the alarm console a selecting 'Show History':

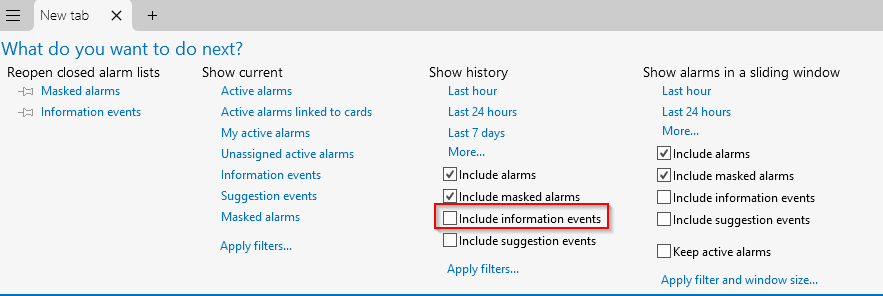
- Could you check in the information events if there was an issue in the DMA (running this element) around the time of the spike?. You can include information events:

- If you are monitoring another KPI (for example Physical Memory Usage), could you double check (using trend graph) if there was any spike or anomaly in this KPI?
Additional information about how to work with the alarm console can be found in the DataMiner Help - Working with the alarm console
Miguel,
Thank You for that detailed investigation. The element was not in time out and I was monitoring another KPI, idle time, which should have gone to 100-value, but didn’t.