Hi Dojo,
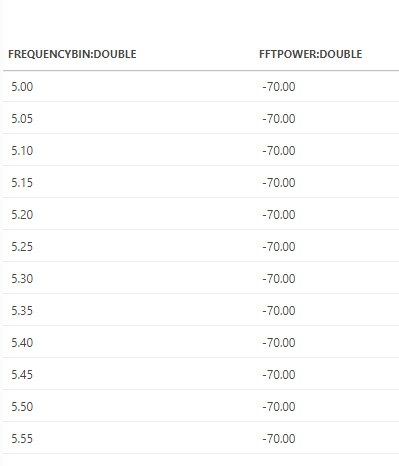
We would like to display the content of a CSV file in a line chart component. By using the ad-hoc data source SLC-GQIDS-CSV, we were able to extract correctly two columns from our CSV file:

When we use this GQI query as data source for our line chart, we see the message ‘There are no dimensions configured’. This is expected since we didn’t configure which column represent Y-Axis, X-Axis yet.
After selecting ‘Layout’ to configure the axis, we noticed that the columns of the GQI query cannot be selected:

Please could you let us what could be wrong with our GQI query?
Thanks.
Hi Miguel,
You can only use numeric values as an x- and y-axis. Since you use the CSV reader ad hoc data source, it does not know which column is intended as a numeric value. You can however use this custom operator to parse a text column to a numeric type. Do this for both numeric columns and the component will work as intended.
Hi Robin,
Thanks for your reply. I believe I found the issue.
The custom operator that I use actually parse the column to a specific data type. Checking the README file I see the following:
“The columns can be automatically parsed to a specific type by suffixing the column name in the CSV header with ::type. Where type can be one of the following: bool, datetime, double, int, string”
In order to identify the data type, the custom operator will check the column name. For example, if you would like to parse the column as double you need to set the column header as follows: ‘myColumnName::double’.
I noticed that in my previous tests I was using one single colon, instead of two. For that reason, the columns were parsed as string and could not find them in the drop-down.
Thanks!