

Hi everyone,
I am using a Line & area chart component in a Low-Code App to display the trending of a bitrate parameter in Mbps.
In the LCA, the chart seems to automatically round the Y-axis values and the tooltip values to only two decimal places. Because of this, several labels are displayed repeatedly as 26.77 Mbps, even though there is variation in the data.
Example in the LCA:
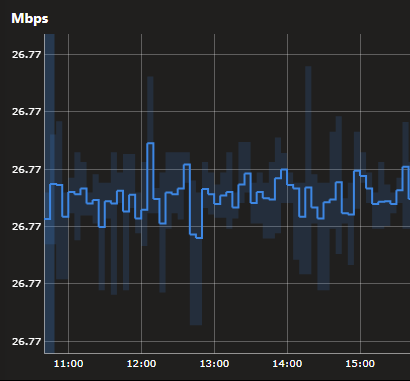
However, when viewing the same parameter in Cube trending, the values are displayed with more decimal places and the variation is represented correctly.
Same data in Cube:
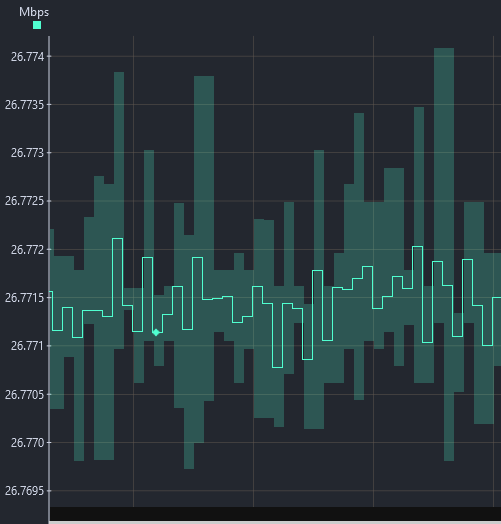
I also exported the data to CSV, directly from the LCA chart, and confirmed that the values do have more decimal places.
Is there any way to configure this component in the LCA to avoid this automatic rounding and display more decimal places on the Y-axis and in the tooltip?
Thanks!

Hi Daniel,
This is a limitation of the line & area chart component with parameter data. There is no way to configure this to show more decimal places or change the rounding. A possible solution is to create a new parameter specifically for the trend visual that is the old parameter multiplied by 10/100/1000/... to have less decimal places.
As a different workaround, you could try and use the same component with a query as data. The 'Get trend data' source can be used to retrieve trend data from a parameter. This will show the data in a different chat, that handles multiple decimal places better.

Hi Wout,
Thank you for the explanation and for the suggested workarounds.
I also tested the option using the Get trend data query as data source. It did improve the precision shown in the tooltip, but I still had limitations with the Y-axis labels in my specific use case.
Considering this, I will proceed with the first suggestion and create a new parameter specifically for this visual, with the value multiplied to reduce the number of decimal places needed in the chart.
Thanks again for the help!