I’m developing a dashboard in DataMiner and need to create a chart or KPI that shows the total value (sum) of the Bitrate Out from a Juniper device port.
I’m using the protocol "Juniper Networks Manager : 1.0.9.10", which currently does not provide a built-in total for this metric. Therefore, my idea is to calculate this total directly in the dashboard by summing the Bitrate Out values over the selected time range in the time range picker — whether for a day, a month, or a year.
What is the best way to configure the query and aggregation so that the widget returns only this total for the selected period? Should I apply the SUM aggregation directly in the query, or is there a better approach using Dojo?
As this question has now been inactive for a very long time, I will close it. If you still want more information about this, could you post a new question?
Hi Rubens,
For this case you could use the ad-hoc data source GetParameterTrendAggregation. Below an example using the time range picker as filter:
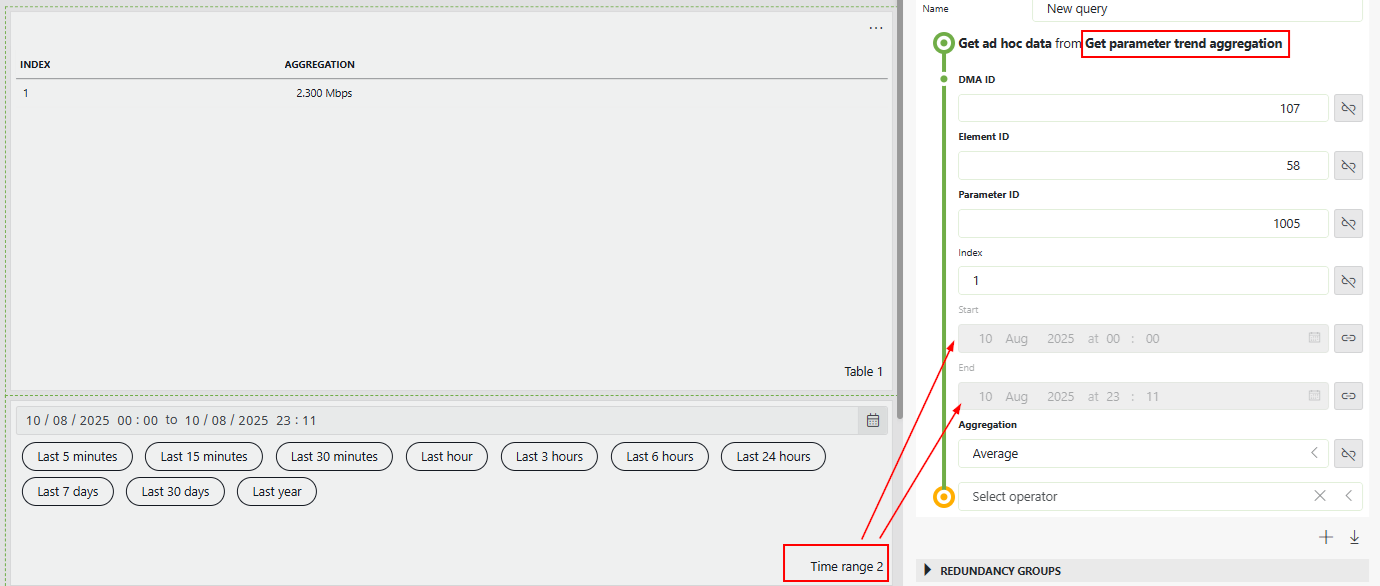
However, this ad-hoc data source does not support the sum operation. You may consider extending the data source to include support for this operation.
Hope it helps.
I see that this question has been inactive for some time. Do you still need help with this? If not, could you select the answer (using the ✓ icon) to indicate that no further follow-up is needed?