Hi,
How can we display a trend of sum of table parameters as a single line?
Use-case is to display summary of In/Out bandwidth from multiple interfaces in the Interface same table.
We don’t want to stack the graphs and we don’t want to use aggregation engine.
Just select few interfaces, eg by regex, get their In/Out trend, sum it and display. Link to a dynamic time feed.
Thank you.
Hi Martin,
I assume you have a single table where each row represents an “Interface” and has the following columns:
- Index (the primary key)
- Bandwidth (trended)
Then it should be possible with a GQI query to create a trend for the sum of the Bandwidth from multiple “Interfaces” in this table.
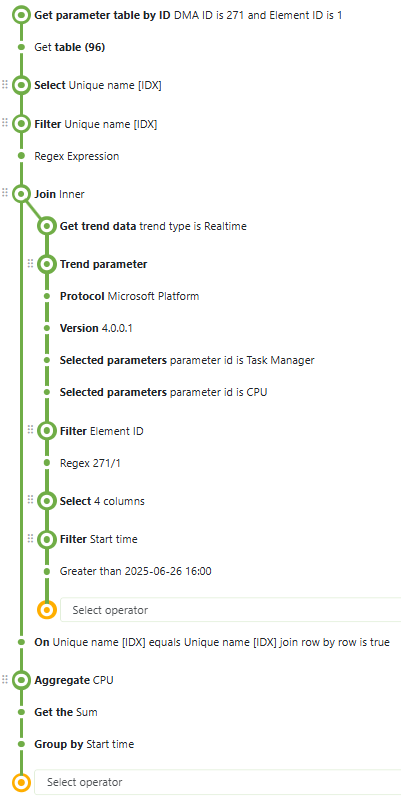
How to build the GQI query
This approach will require a hidden option for joining queries, named “Row by row”. To make this option available, add the showAdvancedSettings=true query parameter in the URL and refresh the webpage. See also: DataMiner Docs: Join
First, create a subquery to fetch the trend data:
- Data source: Get trend data
- Select real-time or average trend data
- Select the protocol and protocol version for the element containing your table
- Select your table parameter
- Select the “Bandwidth” table column
- Select columns: Start time, Index and Bandwidth
- Filter on a specific element
- Filter method: regex
- Value: “^dmaId/elementId$” with the IDs for the element containing your table
- Filter the Start time column on your dynamic time feed
This first query should not be executed on its own. We’ll now create a second query to select the specific interfaces, join on the trend data and then sum the trend values per trend interval:
- Data source: Get parameter table by ID
- Select the DMA ID and Element ID for the element containing your table
- Select your “Interfaces” table
- Select the Index column
- Filter on the “Interfaces” as desired, e.g. using a regex.
Each “Interface” row that matches will be included in the final sum. - Join on the trend subquery we created before:
- Join using the Index column of both queries
- Check the “Row by row” checkbox
This option will only be available if you enabled the “showAdvancedSettings” in the URL.
- Aggregate the Bandwidth column
- Select column “Bandwidth”
- Aggregation method: “Sum”
- Group by “Start time”
The result will be a table with columns “Start time” and “SUM(Bandwidth)” where each row represent an individual trend point. This can then be visualized in a line chart as a single line.
Example query with a different table
Hi Martin,
A possible option to perform this aggregation is using GQI queries. Using the data source Get parameters for elements where you can retrieve values from column parameters. Using the filter operator, you can filter values from specific interfaces.
Below an example. In this case we are filtering two interfaces: ‘Ethernet1/1’ and ‘Ethernet1/2’:
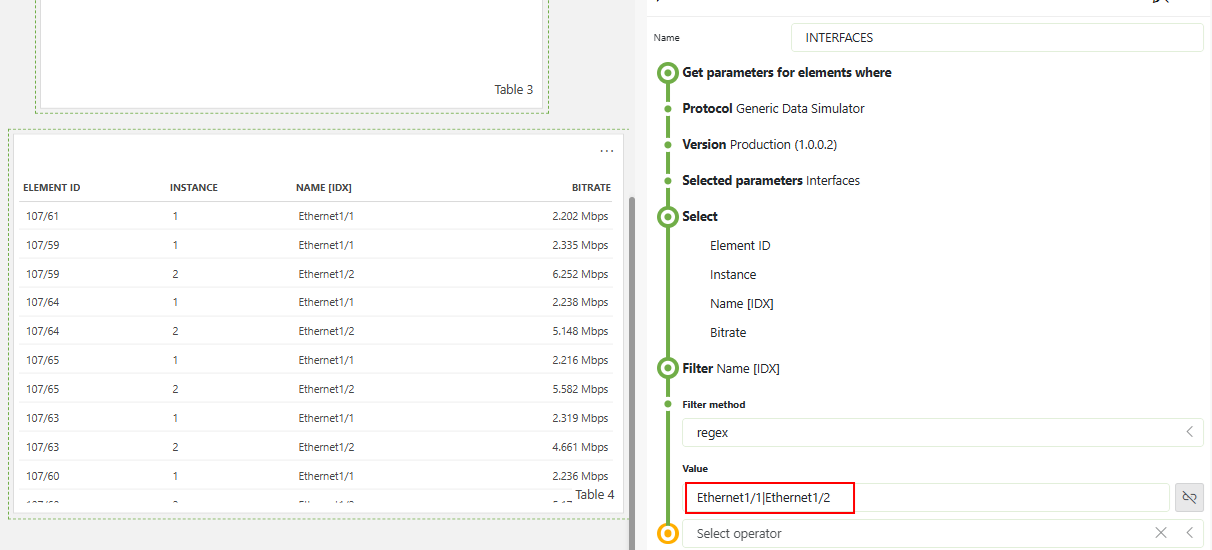
Using the ‘Aggregate’ operator together with option ‘Group by’ you can sum the values for each table and group by element:
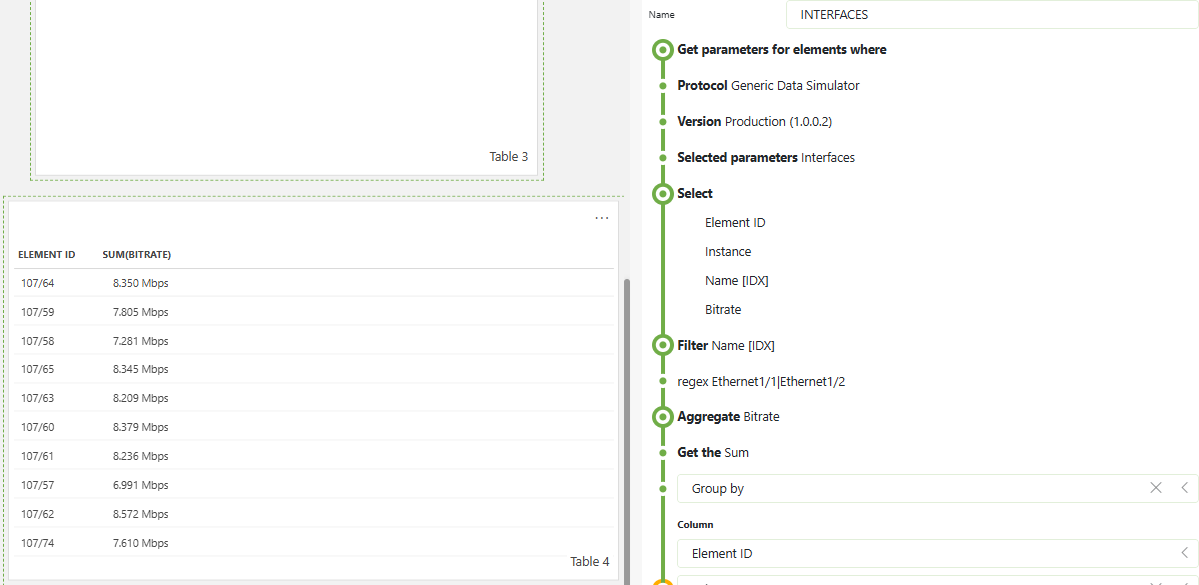
If you would like to store this aggregation so it can be displayed in a trend chart, you could use Data Aggregator.
Hope it helps.
Hi Miguel,
It helps, thanks, but does not answer my question – we need to display a trend of the sum value, not a table. Can it be done? Thanks.
Hi Martin,
I see that this question has been inactive for some time. Do you still need help with this? If not, could you select the answer that has been most helpful for you (using the ✓ icon) to indicate that no further follow-up is needed?