I’m building a dashboard in DataMiner and I need to create a chart (or KPI) that displays the total value for the period selected in the time range picker.
Could someone explain the best way to configure the query and aggregation so that the widget returns only the total for the selected time range?
I’m not sure if I should use Sum aggregation directly in the query or if there’s a better approach in Dojo.
Marieke Goethals [SLC] [DevOps Catalyst] Selected answer as best
Hi Rubens,
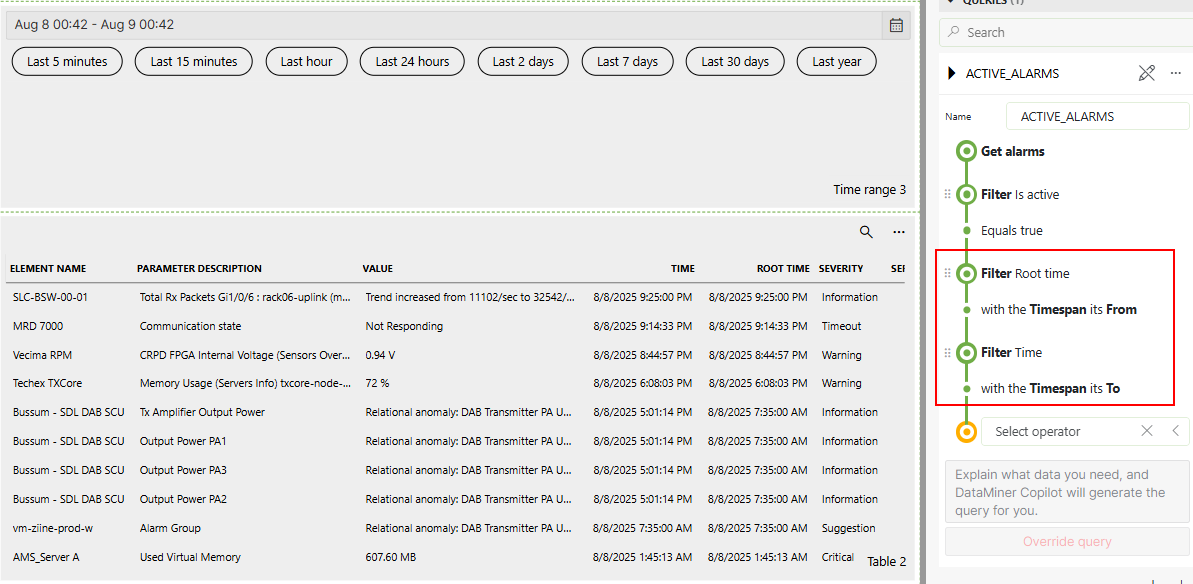
For example, using a data source that includes time (Get Alarms), you could use the properties 'From' and 'To' from the time range component as a filter for you query:
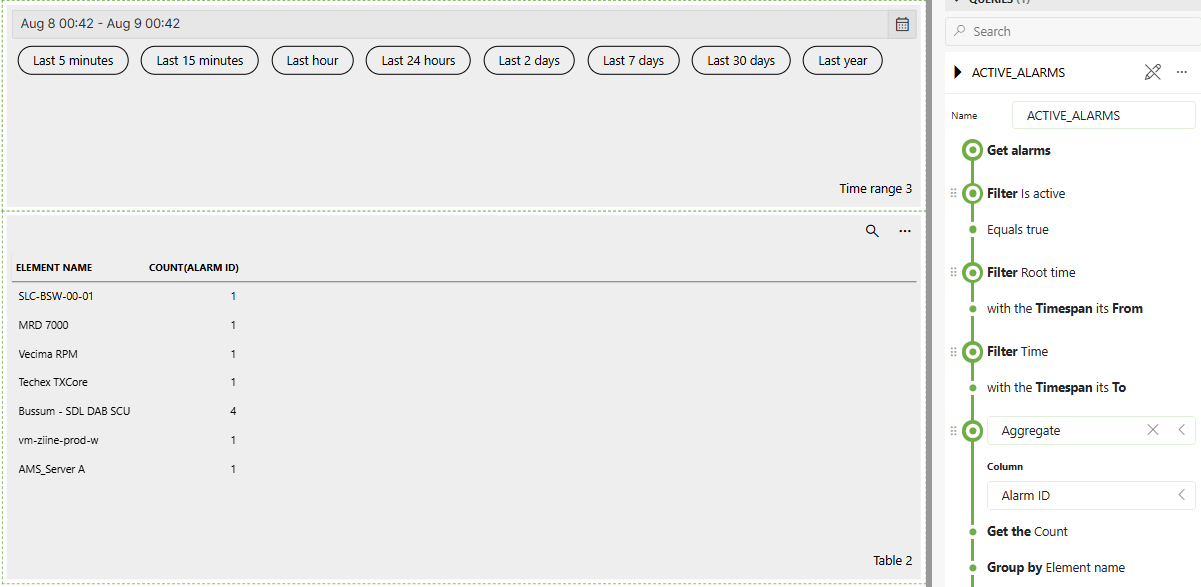
Next, you can use the 'aggregate' operator. The example below counts the number of alarms and group the result by element:
Hope it helps.
Marieke Goethals [SLC] [DevOps Catalyst] Selected answer as best