Skip to content
DataMiner DoJo

More results...

Generic selectors
Exact matches only
Search in title
Search in content
Post Type Selectors
Search in posts
Search in pages
Search in posts
Search in pages
Log in
Menu
  • Updates & Insights
  • Questions
  • Learning
    • E-learning Courses
    • Empower Replay: Limited Edition
    • Tutorials
    • Open Classroom Training
    • Certification
      • DataMiner Fundamentals
      • DataMiner Configurator
      • DataMiner Automation
      • Scripts & Connectors Developer: HTTP Basics
      • Scripts & Connectors Developer: SNMP Basics
      • Visual Overview – Level 1
      • Verify a certificate
    • Video Library
    • Books We Like
    • >> Go to DataMiner Docs
  • Expert Center
    • Solutions & Use Cases
      • Solutions
      • Use Case Library
    • Markets & Industries
      • Media production
      • Government & defense
      • Content distribution
      • Service providers
      • Partners
      • OSS/BSS
    • Agile
      • Agile Webspace
      • Everything Agile
        • The Agile Manifesto
        • Best Practices
        • Retro Recipes
      • Methodologies
        • The Scrum Framework
        • Kanban
        • Extreme Programming
      • Roles
        • The Product Owner
        • The Agile Coach
        • The Quality & UX Coach (QX)
    • DataMiner DevOps Professional Program
      • About the DevOps Program
      • DataMiner DevOps Support
  • Downloads
  • More
    • DataMiner Releases & Updates
    • Feature Suggestions
    • Climb the leaderboard!
    • Swag Shop
    • Contact
    • Global Feedback Survey
  • PARTNERS
    • All Partners
    • Technology Partners
    • Strategic Partner Program
    • Deal Registration
  • >> Go to dataminer.services

How to configure data for gauge?

269 views7th April 2025
2
Apurva Tandon [DevOps Advocate]1.61K 3rd April 2025 0 Comments

How to have gauges for all these rows and rows can be dyanmic and how to configure it ??
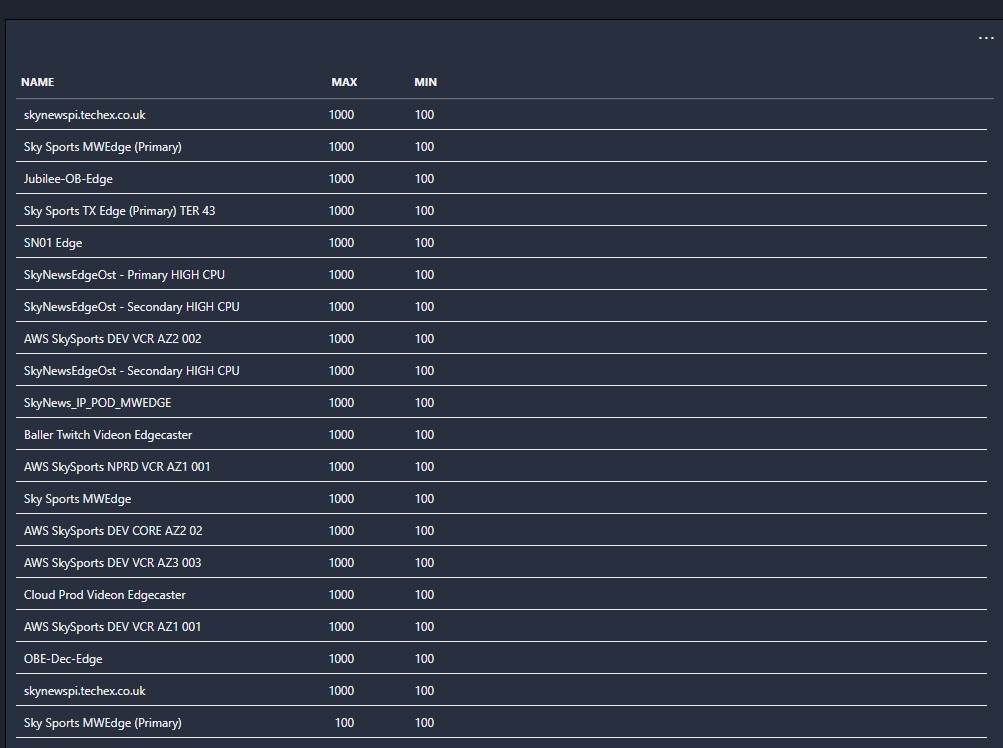
Felix Wesemeier [DevOps Catalyst] Answered question 4th April 2025

2 Answers

  • Active
  • Voted
  • Newest
  • Oldest
2
Wout Mahieu [SLC] [DevOps Catalyst]7.66K Posted 4th April 2025 3 Comments

Hi Apurva,

It is not possible to configure a dynamic amount of Gauge components directly from a query result. If all these rows represent parameters and they have parameter metadata, then the selected rows of a table can be linked to a Gauge component. Note that only the selected rows will be shown as Gauges, not all the rows.

Do these have to be Gauge components specifically? It is already possible to create shapes with a dynamic width in templates, which can be displayed for each row of a query result. These could represent a progress bar of some sort.

Update: Config sample

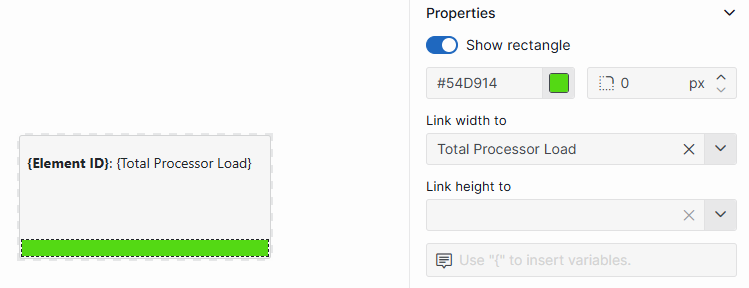
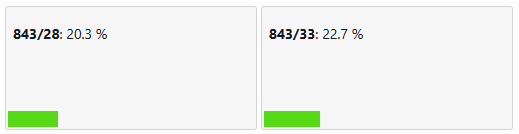
The only thing you need to configure a bar like this is a percentage value that represents the width of the bar. This column (here ‘Total Processor Load’) can then be used to be linked to the width of the bar.

Wout Mahieu [SLC] [DevOps Catalyst] Posted new comment 7th April 2025
Apurva Tandon [DevOps Advocate] commented 4th April 2025

Hi Thanks, if possible can you share some sample like how can have layout int his form and how will it pick these values from rows and show

Apurva Tandon [DevOps Advocate] commented 4th April 2025

To point of are these parameter values yes they are but I want something dynamic as for params to show can change based on protocol.

Wout Mahieu [SLC] [DevOps Catalyst] commented 7th April 2025

I have added a sample from my config to the answer. This is a dynamic way to display the values as there will always be 1 grid item per row in the query. If the query result updates, the visual will follow.

0
Felix Wesemeier [DevOps Catalyst]1.82K Posted 4th April 2025 2 Comments

Hi Apurva,

as you already have the values in a table, you could also use e.g. the table or grid component and some CSS code for a ring or gauge to build your own.

Dynamic Example inside an LCA table column:

Another Example with grid: Dashboard – Using Table Count Data in a Gauge – DataMiner Dojo

Felix Wesemeier [DevOps Catalyst] Edited comment 8th April 2025
Apurva Tandon [DevOps Advocate] commented 4th April 2025

Hi Thanks,

It would be really nice if I can get some gif or snippet how to setup that or some live example.

Felix Wesemeier [DevOps Catalyst] commented 4th April 2025

Go to the template editor of grid or table column.
In the editor you need to create a text field.
The value of the field is e.g.:
<div class="yourCSSClassName" minAttribute="{MIN}" maxAttribute="{MAX}>Additional text here if you need it</div>
<style>
.yourCSSClassName {
your CSS code here
}
</style>

Please login to be able to comment or post an answer.

My DevOps rank

DevOps Members get more insights on their profile page.

My user earnings

0 Dojo credits

Spend your credits in our swag shop.

0 Reputation points

Boost your reputation, climb the leaderboard.

Promo banner DataMiner DevOps Professiona Program
DataMiner Integration Studio (DIS)
Empower Katas
Privacy Policy • Terms & Conditions • Contact

© 2025 Skyline Communications. All rights reserved.

DOJO Q&A widget

Can't find what you need?

? Explore the Q&A DataMiner Docs