Skip to content
DataMiner DoJo

More results...

Generic selectors
Exact matches only
Search in title
Search in content
Post Type Selectors
Search in posts
Search in pages
Search in posts
Search in pages
Log in
Menu
  • Blog
  • Questions
  • Learning
    • E-learning Courses
    • Open Classroom Training
    • Certification
      • DataMiner Fundamentals
      • DataMiner Configurator
      • DataMiner Automation
      • Scripts & Connectors Developer: HTTP Basics
      • Scripts & Connectors Developer: SNMP Basics
      • Visual Overview – Level 1
      • Verify a certificate
    • Tutorials
    • Video Library
    • Books We Like
    • >> Go to DataMiner Docs
  • Expert Center
    • Solutions & Use Cases
      • Solutions
      • Use Case Library
    • Markets & Industries
      • Media production
      • Government & defense
      • Content distribution
      • Service providers
      • Partners
      • OSS/BSS
    • DataMiner Insights
      • Security
      • Integration Studio
      • System Architecture
      • DataMiner Releases & Updates
      • DataMiner Apps
    • Agile
      • Agile Webspace
      • Everything Agile
        • The Agile Manifesto
        • Best Practices
        • Retro Recipes
      • Methodologies
        • The Scrum Framework
        • Kanban
        • Extreme Programming
      • Roles
        • The Product Owner
        • The Agile Coach
        • The Quality & UX Coach (QX)
    • DataMiner DevOps Professional Program
  • Downloads
  • More
    • Feature Suggestions
    • Climb the leaderboard!
    • Swag Shop
    • Contact
      • General Inquiries
      • DataMiner DevOps Support
      • Commercial Requests
    • Global Feedback Survey
  • PARTNERS
    • All Partners
    • Technology Partners
    • Strategic Partner Program
    • Deal Registration
  • >> Go to dataminer.services

How can I show the aggregated traffic for two interfaces from different elements?

Solved1.36K views13th July 2023aggregation Dashboard
1
Bruno Sousa [DevOps Member]669 9th June 2021 0 Comments

Hello

I have a requirement for showing the aggregated traffic for two interfaces that are in two different elements.

I'm having some difficulties on implementing the requirement to my internal client though, who is now waiting for this to be available for quite a while.

What is the approach you recommend for obtaining this using Dataminer?

Thank you.

Best regards

Bruno Sousa

Marieke Goethals [SLC] [DevOps Catalyst] Selected answer as best 13th July 2023

1 Answer

  • Active
  • Voted
  • Newest
  • Oldest
1
Laurens Moutton [SLC] [DevOps Enabler]8.73K Posted 9th June 2021 6 Comments

Hi,

If both elements are from the same driver and are the same parameter then the most easy thing to use is the Aggregation Rules on a surveyor view. See help

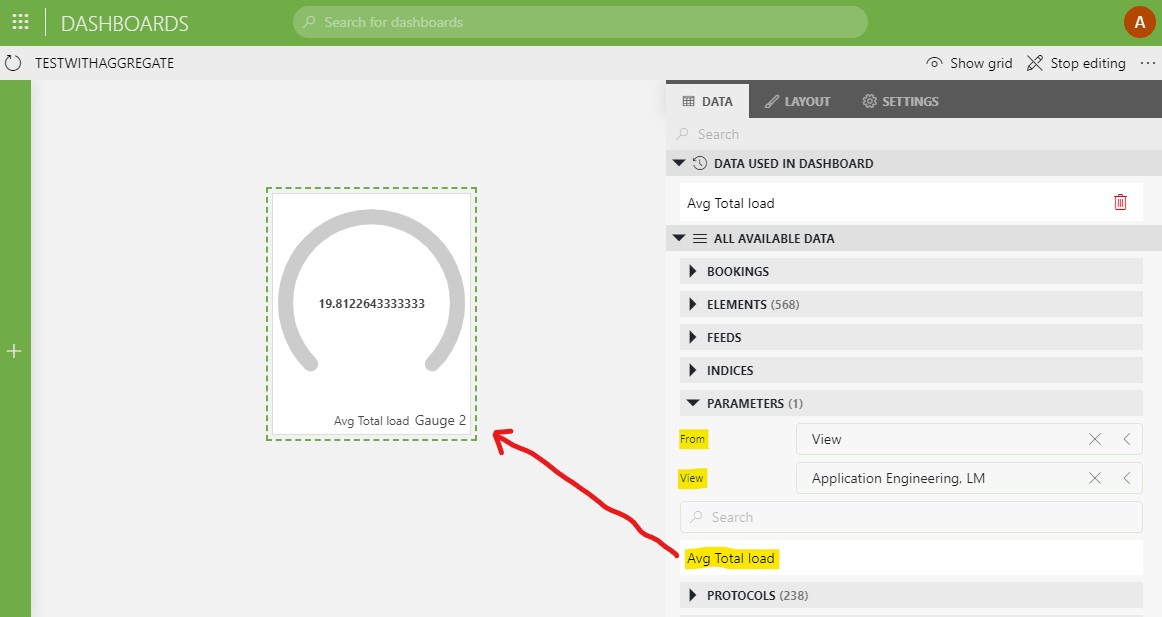
EDIT: Extra info on how to access such parameter: with the new dashboard component, this is available under "Parameters", select From: "View", View is then the required view with an active aggregation rule, below that are then the aggregation rule parameters available for the dashboard component. Below screenshot was taken with DataMiner 10.1.6.0

Marieke Goethals [SLC] [DevOps Catalyst] Selected answer as best 13th July 2023
Bruno Sousa [DevOps Member] commented 9th June 2021

Hello Laurens,

I have that.. but the client wants something he could easily share with others.. any option?

Aggregation rules have also some limitations in the expressions we can use to do them, if I remind well…

Thank you.

Best regards
Bruno Sousa

Laurens Moutton [SLC] [DevOps Enabler] commented 9th June 2021

According to this help: https://help.dataminer.services/dataminer/#t=DataMinerUserGuidepart_4dashboardsDashboard_components.htm , dashboards can have an aggregation component and dashboards can be shared so that could be an option to be able to share it

Bruno Sousa [DevOps Member] commented 9th June 2021

Yes.. but only in the “old” Dashboards right? Still not possible in the new app?

Thank you.

Laurens Moutton [SLC] [DevOps Enabler] commented 9th June 2021

It is possible to get it in the new app.
In the data part, “All available data”, there is a section called “Parameters”, if that one is expanded then there is a part “From” for which it should then be set to “View”. Then in “View” select the surveyor view name from which you want to get the aggregated parameter and then beneath the search the available aggregated parameters are visible which can be used (in case the aggregation rule is enabled). Drag and drop that parameter into the design area and pick a visualization and the aggregated parameter content will be present on the dashboard

Bruno Sousa [DevOps Member] commented 9th June 2021

Laurens

Thank you!

I think this will be very helpfull!

I didn’t realize I could present aggregation rules this way.

I will try it out!

Best regards
Bruno Sousa

Show 1 more comments
Please login to be able to comment or post an answer.

My DevOps rank

DevOps Members get more insights on their profile page.

My user earnings

0 Dojo credits

Spend your credits in our swag shop.

0 Reputation points

Boost your reputation, climb the leaderboard.

Promo banner DataMiner DevOps Professiona Program
DataMiner Integration Studio (DIS)
Empower Katas

Recent questions

Web Applications exception in Cube due to invalid certificate 0 Answers | 0 Votes
Redundancy Groups and Alarming – Duplicate Alarms 0 Answers | 0 Votes
Correlation Engine: “Test rule” doesn’t result in a hit, despite functional rule 1 Answer | 3 Votes

Question Tags

adl2099 (115) alarm (62) Alarm Console (82) alarms (100) alarm template (83) Automation (223) automation scipt (111) Automation script (167) backup (71) Cassandra (180) Connector (109) Correlation (69) Correlation rule (52) Cube (151) Dashboard (194) Dashboards (188) database (83) DataMiner Cube (57) DIS (81) DMS (71) DOM (140) driver (65) DVE (56) Elastic (83) Elasticsearch (115) elements (80) Failover (104) GQI (159) HTTP (76) IDP (74) LCA (152) low code app (166) low code apps (93) lowcodeapps (75) MySQL (53) protocol (203) QAction (83) security (88) SNMP (86) SRM (337) table (54) trending (87) upgrade (62) Visio (539) Visual Overview (345)
Privacy Policy • Terms & Conditions • Contact

© 2025 Skyline Communications. All rights reserved.

DOJO Q&A widget

Can't find what you need?

? Explore the Q&A DataMiner Docs

[ Placeholder content for popup link ] WordPress Download Manager - Best Download Management Plugin