Skip to content
DataMiner DoJo

More results...

Generic selectors
Exact matches only
Search in title
Search in content
Post Type Selectors
Search in posts
Search in pages
Search in posts
Search in pages
Log in
Menu
  • Blog
  • Questions
  • Learning
    • E-learning Courses
    • Open Classroom Training
    • Certification
      • DataMiner Fundamentals
      • DataMiner Configurator
      • DataMiner Automation
      • Scripts & Connectors Developer: HTTP Basics
      • Scripts & Connectors Developer: SNMP Basics
      • Visual Overview – Level 1
      • Verify a certificate
    • Tutorials
    • Video Library
    • Books We Like
    • >> Go to DataMiner Docs
  • Expert Center
    • Solutions & Use Cases
      • Solutions
      • Use Case Library
    • Markets & Industries
      • Media production
      • Government & defense
      • Content distribution
      • Service providers
      • Partners
      • OSS/BSS
    • DataMiner Insights
      • Security
      • Integration Studio
      • System Architecture
      • DataMiner Releases & Updates
      • DataMiner Apps
    • Agile
      • Agile Webspace
      • Everything Agile
        • The Agile Manifesto
        • Best Practices
        • Retro Recipes
      • Methodologies
        • The Scrum Framework
        • Kanban
        • Extreme Programming
      • Roles
        • The Product Owner
        • The Agile Coach
        • The Quality & UX Coach (QX)
    • DataMiner DevOps Professional Program
  • Downloads
  • More
    • Feature Suggestions
    • Climb the leaderboard!
    • Swag Shop
    • Contact
      • General Inquiries
      • DataMiner DevOps Support
      • Commercial Requests
    • Global Feedback Survey
  • PARTNERS
    • All Partners
    • Technology Partners
    • Strategic Partner Program
    • Deal Registration
  • >> Go to dataminer.services

Graph without data in query Low Code Apps

Solved355 views16th April 2025
0
Juan Falcon125 13th November 2024 0 Comments

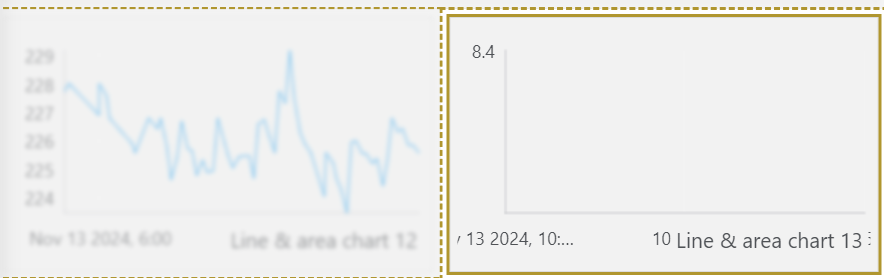
Hello with a low code app using graph it show only some points, if the value dont change the graph loss details.

using a time filter on last 24H it has some values and show this image

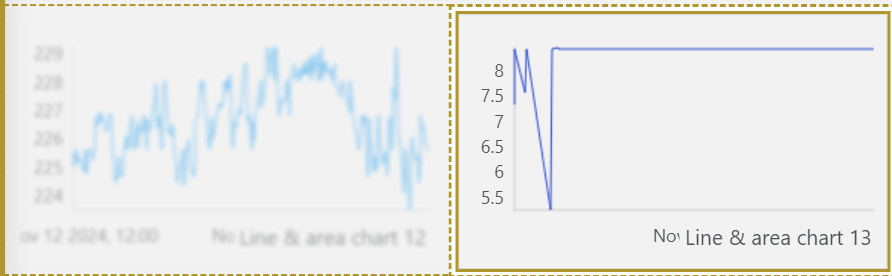
then i use the filter with last hour or 6 hour the graph is emply

The left graph show correct the values because it has mor variation, the config between the two parameetrs its the same, the oly diference is the variance.

Juan Falcon Selected answer as best 16th April 2025

1 Answer

  • Active
  • Voted
  • Newest
  • Oldest
1
Wout Mahieu [SLC] [DevOps Catalyst]7.47K Posted 14th November 2024 4 Comments

Hi Juan

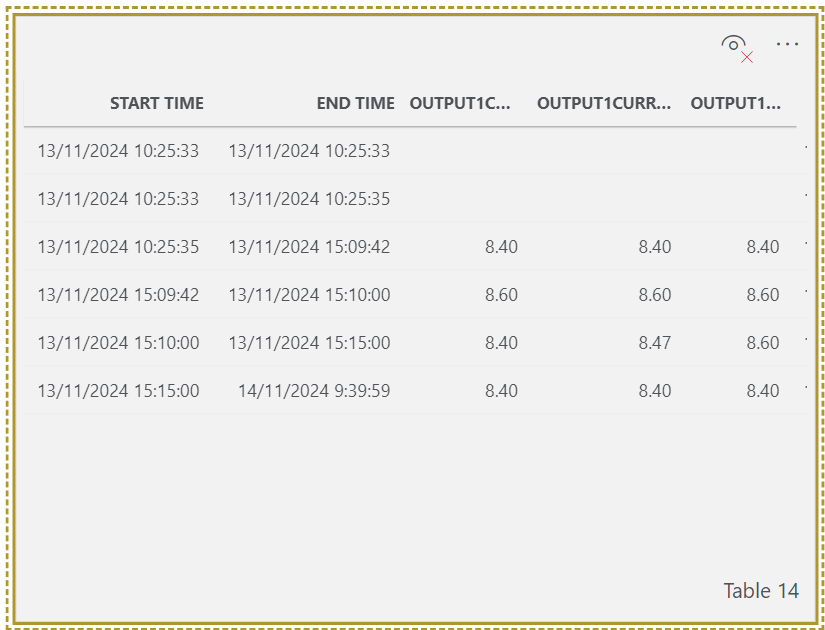
Can you try visualizing the data from the right graph in a table visualization? This will give you a clear overview of the trend points that the graph is displaying. If no rows are returned from the query, no points (& lines) will be drawn on the graph. It seems that in your example the query on the right doesn't have a lot of data for the last 24h and none at all for last 6h.

Juan Falcon Selected answer as best 16th April 2025
Juan Falcon commented 14th November 2024

hi Wout, i understand what valued are only strorage if it change, if is the same is not starage so in 24h data it has some points but in 6hr have not the last point that happen more hours ago, even the grave have not the correct scale in x-axe, it shoud show line doring the constan value, it works ok on cube.

Wout Mahieu [SLC] [DevOps Catalyst] commented 15th November 2024

Hi Juan
This line & area chart component doesn't (& isn't supposed to) behave the same as in Cube when adding a query as data. With a query, the component should draw lines between all points (=rows) of the query. It doesn't fetch extra rows for data outside the bounds of the graph. If you want the same behavior as in Cube, you can add a parameter as data instead of the query. Then the component will look at past & possible future trend data as well. (see https://docs.dataminer.services/user-guide/Advanced_Modules/Dashboards_and_Low_Code_Apps/Visualizations/Available_visualizations/Charts/Line_and_area_chart.html?q=line++area&tabs=tabid-1#configuring-the-component)

Juan Falcon commented 15th November 2024

this component can use the element ID and idx from the selector element?

Wout Mahieu [SLC] [DevOps Catalyst] commented 18th November 2024

The component needs a element parameter as an input or a protocol parameter with an element filter. If you know the ID, you can fetch the parameter using a query.

You are viewing 1 out of 1 answers, click here to view all answers.
Please login to be able to comment or post an answer.

My DevOps rank

DevOps Members get more insights on their profile page.

My user earnings

0 Dojo credits

Spend your credits in our swag shop.

0 Reputation points

Boost your reputation, climb the leaderboard.

Promo banner DataMiner DevOps Professiona Program
DataMiner Integration Studio (DIS)
Empower Katas

Recent questions

Web Applications exception in Cube due to invalid certificate 0 Answers | 0 Votes
Redundancy Groups and Alarming – Duplicate Alarms 0 Answers | 0 Votes
Correlation Engine: “Test rule” doesn’t result in a hit, despite functional rule 1 Answer | 3 Votes

Question Tags

adl2099 (115) alarm (62) Alarm Console (82) alarms (100) alarm template (83) Automation (223) automation scipt (111) Automation script (167) backup (71) Cassandra (180) Connector (109) Correlation (69) Correlation rule (52) Cube (151) Dashboard (194) Dashboards (188) database (83) DataMiner Cube (57) DIS (81) DMS (71) DOM (140) driver (65) DVE (56) Elastic (83) Elasticsearch (115) elements (80) Failover (104) GQI (159) HTTP (76) IDP (74) LCA (152) low code app (166) low code apps (93) lowcodeapps (75) MySQL (53) protocol (203) QAction (83) security (88) SNMP (86) SRM (337) table (54) trending (87) upgrade (62) Visio (539) Visual Overview (345)
Privacy Policy • Terms & Conditions • Contact

© 2025 Skyline Communications. All rights reserved.

DOJO Q&A widget

Can't find what you need?

? Explore the Q&A DataMiner Docs

[ Placeholder content for popup link ] WordPress Download Manager - Best Download Management Plugin