Skip to content
DataMiner DoJo

More results...

Generic selectors
Exact matches only
Search in title
Search in content
Post Type Selectors
Search in posts
Search in pages
Search in posts
Search in pages
Log in
Menu
  • Updates & Insights
  • Questions
  • Learning
    • E-learning Courses
    • Empower Replay: Limited Edition
    • Tutorials
    • Open Classroom Training
    • Certification
      • DataMiner Fundamentals
      • DataMiner Configurator
      • DataMiner Automation
      • Scripts & Connectors Developer: HTTP Basics
      • Scripts & Connectors Developer: SNMP Basics
      • Visual Overview – Level 1
      • Verify a certificate
    • Video Library
    • Books We Like
    • >> Go to DataMiner Docs
  • Expert Center
    • Solutions & Use Cases
      • Solutions
      • Use Case Library
    • Markets & Industries
      • Media production
      • Government & defense
      • Content distribution
      • Service providers
      • Partners
      • OSS/BSS
    • Agile
      • Agile Webspace
      • Everything Agile
        • The Agile Manifesto
        • Best Practices
        • Retro Recipes
      • Methodologies
        • The Scrum Framework
        • Kanban
        • Extreme Programming
      • Roles
        • The Product Owner
        • The Agile Coach
        • The Quality & UX Coach (QX)
    • DataMiner DevOps Professional Program
      • About the DevOps Program
      • DataMiner DevOps Support
  • Downloads
  • More
    • DataMiner Releases & Updates
    • Feature Suggestions
    • Climb the leaderboard!
    • Swag Shop
    • Contact
    • Global Feedback Survey
  • PARTNERS
    • All Partners
    • Technology Partners
    • Strategic Partner Program
    • Deal Registration
  • >> Go to dataminer.services

ElasticSearch Cluster Monitor – improper CPU monitoring

Solved327 views12th May 2025opensearch
2
Miloš Sedláček [DevOps Advocate]676 26th November 2024 3 Comments

Dear community,

we are investigating use of ElasticSearch Cluster Monitor connector for monitoring of our Opensearch cluster.

It seems to be working fine except the CPU utilization monitoring.

We run our 3 openesearch nodes as containers. We monitor the container CPU utilization on host OS level and with above mentioned connector too. The results differ significantly. When an indexing DB demanding operation is run, we see 100% CPU utilization on OS level, but only couple % (e.g. 3%) in the DMA. This disproporition is present in an idle state as well (0% in DMA while some percentage in OS).

Looking closer inside the opensearch container I found there are 3 opensearch processes running:

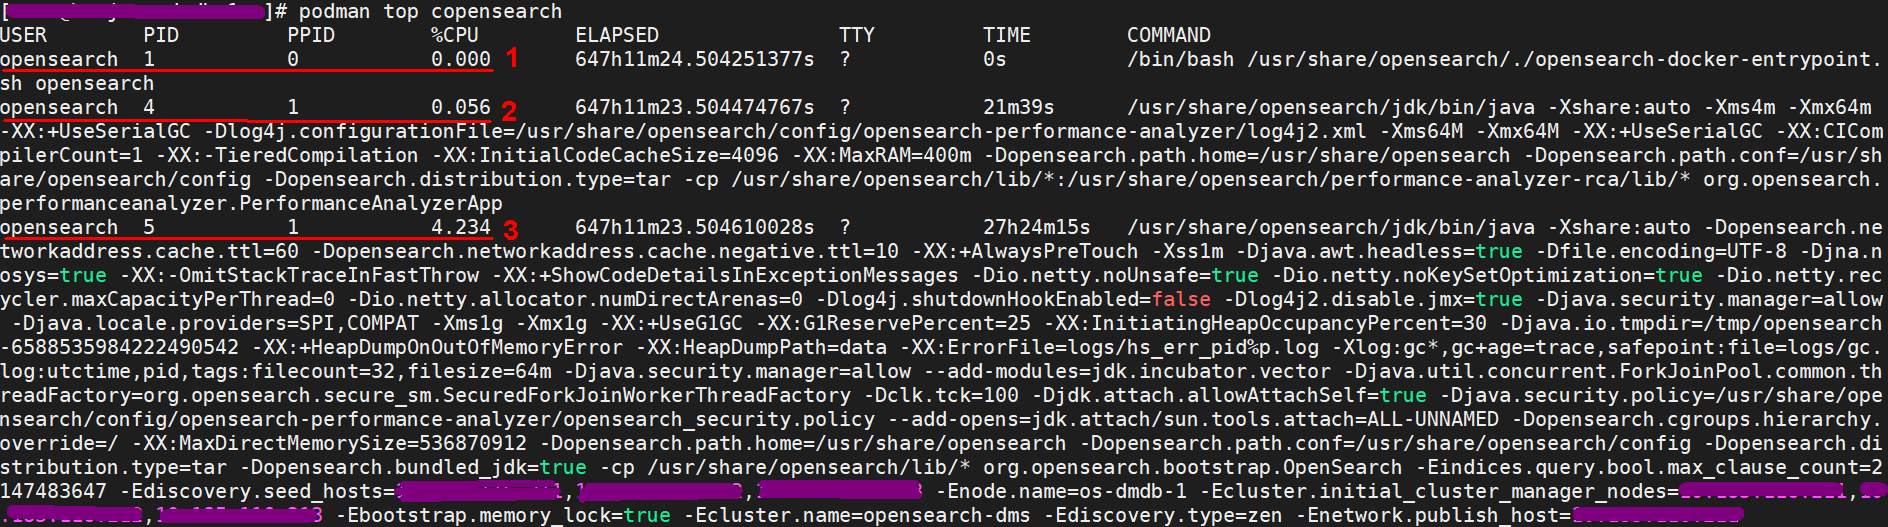
Note, the %CPU in the screenshot above is an long term average, not the current usage. Taking into consideration this fact and the values of %CPU it seems the ElasticSearch connector is monitoring the 2nd process. But, the real work is done by the 3rd process, which is also obvious by the command it represents (the real database configuration).

Is there a way to choose the process in the Opensearch instance (be it bare metal, VM or container) to be monitored by the Dataminer ElasticSearch connector?

Miloš Sedláček [DevOps Advocate] Selected answer as best 12th May 2025
Rene De Posada [SLC] [DevOps Advocate] commented 27th November 2024

Could you please specify the version of the connector you are using? Is it the latest and greatest? https://catalog.dataminer.services/details/afe7853b-2784-467c-8cd9-71be79d9ca50

Miloš Sedláček [DevOps Advocate] commented 28th November 2024

We use the latest version in the catalog – 1.0.1.10.
Note, the low CPU load is shown by the Elasticvue. It's because this data is most likely based on REST call "_nodes/stats/os" That really gives the low CPU usages:
"os": {
"timestamp": 1732782379780,
"cpu": {
"percent": 0,
"load_average": {
"1m": 0.13,
"5m": 0.13,
"15m": 0.15
}
}

However the fact in our deployment is that we need to collect the CPU usage of a different process I believe..

Marieke Goethals [SLC] [DevOps Catalyst] commented 9th May 2025

Hi Miloš,
I see that this question has been inactive for some time. Do you still need help with this? If not, could you select the answer (using the ✓ icon) to indicate that no further follow-up is needed?

1 Answer

  • Active
  • Voted
  • Newest
  • Oldest
1
Rafael Duarte [SLC] [DevOps Advocate]174 Posted 28th November 2024 1 Comment

Hi Milos,

I had a look at the connector, and it does indeed use the REST API to monitor the cluster, specifically retrieving CPU usage via the _nodes/stats REST call. Additionally, I found two other parameters related to CPU percentage:

  • CPU Usage in the Operating System Statistics table, found on the Node Stats – OS / Processes page.
  • CPU Usage in the Process Statistics table, also located on the Node Stats – OS / Processes page.

Could you confirm if either of these matches the CPU usage you’re referring to?

If not, it seems a connector change would be necessary, and the appropriate REST API call would need to be implemented to retrieve the desired parameter.
Kind regards,

Miloš Sedláček [DevOps Advocate] Selected answer as best 12th May 2025
Miloš Sedláček [DevOps Advocate] commented 12th May 2025

Hi Rafael,
..answering after some time. That CPU usages still do not reflect the real CPU usage I see on the OS level.
Thank you anyway.

Please login to be able to comment or post an answer.

My DevOps rank

DevOps Members get more insights on their profile page.

My user earnings

0 Dojo credits

Spend your credits in our swag shop.

0 Reputation points

Boost your reputation, climb the leaderboard.

Promo banner DataMiner DevOps Professiona Program
DataMiner Integration Studio (DIS)
Empower Katas
Privacy Policy • Terms & Conditions • Contact

© 2025 Skyline Communications. All rights reserved.

DOJO Q&A widget

Can't find what you need?

? Explore the Q&A DataMiner Docs