Hi,
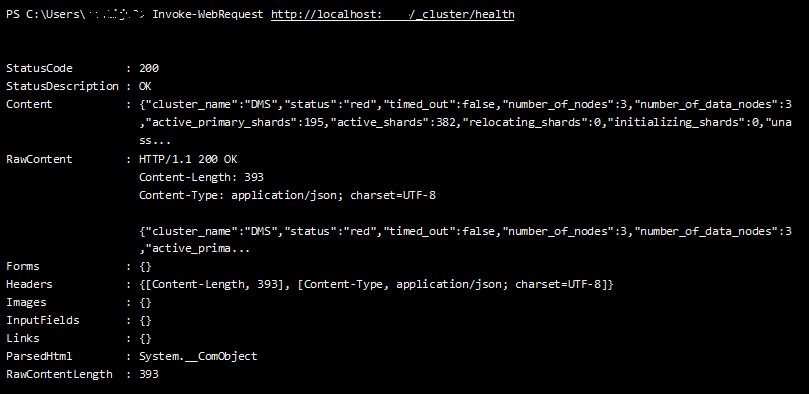
After installing the monthly security updates for Elastic, there are now issues on a DM Cluster. This is what we see when requesting the cluster health:

What seems to be the issue here and how can this be fixed?
Kind regards,
Hi Ive, this is the content:
{“cluster_name”:”DMS”,”status”:”red”,”timed_out”:false,”number_of_nodes”:3,”number_of_data_nodes”:3,”active_primary_shards”:195,”active_shards”:382,”relocating_shards”:0,”initializing_shards”:0,”unassigned_shards”:2,”delayed_unassigned_shards”:0,”number_of_pending_tasks”:0,”number_of_in_flight_fetch”:0,”task_max_waiting_in_queue_millis”:0,”active_shards_percent_as_number”:99.47916666666666}
Hi Thomas,
From the health output, I can see that there are 2 unassigned shards.
This will be the cause of the red health state.
You can send a GET "/_cluster/allocation/explain" call to your elastic cluster to get more details.
If the output reports that the shards exceeded the maximum number of retries on failed allocation attempts, you can send the following POST to retry:
POST /_cluster/reroute?retry_failed=true
Okay, posting that command seemed to have fixed the issue. Checking the health again returned a cluster status of green. Thanks a lot for the help!
Hi Thomas,
From your screenshot, it’s possible to see the status is RED, but it’s not possible to see what the problem is. Can you see if there is more info in the contents section of the response? (it’s truncated in your screenshot)