Skip to content
DataMiner DoJo

More results...

Generic selectors
Exact matches only
Search in title
Search in content
Post Type Selectors
Search in posts
Search in pages
Search in posts
Search in pages
Log in
Menu
  • Updates & Insights
  • Questions
  • Learning
    • E-learning Courses
    • Empower Replay: Limited Edition
    • Tutorials
    • Open Classroom Training
    • Certification
      • DataMiner Fundamentals
      • DataMiner Configurator
      • DataMiner Automation
      • Scripts & Connectors Developer: HTTP Basics
      • Scripts & Connectors Developer: SNMP Basics
      • Visual Overview – Level 1
      • Verify a certificate
    • Video Library
    • Books We Like
    • >> Go to DataMiner Docs
  • Expert Center
    • Solutions & Use Cases
      • Solutions
      • Use Case Library
    • Markets & Industries
      • Media production
      • Government & defense
      • Content distribution
      • Service providers
      • Partners
      • OSS/BSS
    • Agile
      • Agile Webspace
      • Everything Agile
        • The Agile Manifesto
        • Best Practices
        • Retro Recipes
      • Methodologies
        • The Scrum Framework
        • Kanban
        • Extreme Programming
      • Roles
        • The Product Owner
        • The Agile Coach
        • The Quality & UX Coach (QX)
    • DataMiner DevOps Professional Program
      • About the DevOps Program
      • DataMiner DevOps Support
  • Downloads
  • More
    • DataMiner Releases & Updates
    • Feature Suggestions
    • Climb the leaderboard!
    • Swag Shop
    • Contact
    • Global Feedback Survey
  • PARTNERS
    • All Partners
    • Technology Partners
    • Strategic Partner Program
    • Deal Registration
  • >> Go to dataminer.services

Display consolidated data for multiple DMA monitoring protocol(MS platform).

153 views4th April 2025dasboards Dashboads dashboard chart multiple items
1
Raghav Nanda44 4th April 2025 0 Comments

I was trying to display several parameters from the MS Platform protocol for various DMAs. I was able to display the data successfully for one DMA node. I was looking for the best way to create a dashboard that would show me same parameters from all the DMAs. So far I added components(for each parameter) for each DMA. Please Let me know if anyone knows a better way to achieve the same.

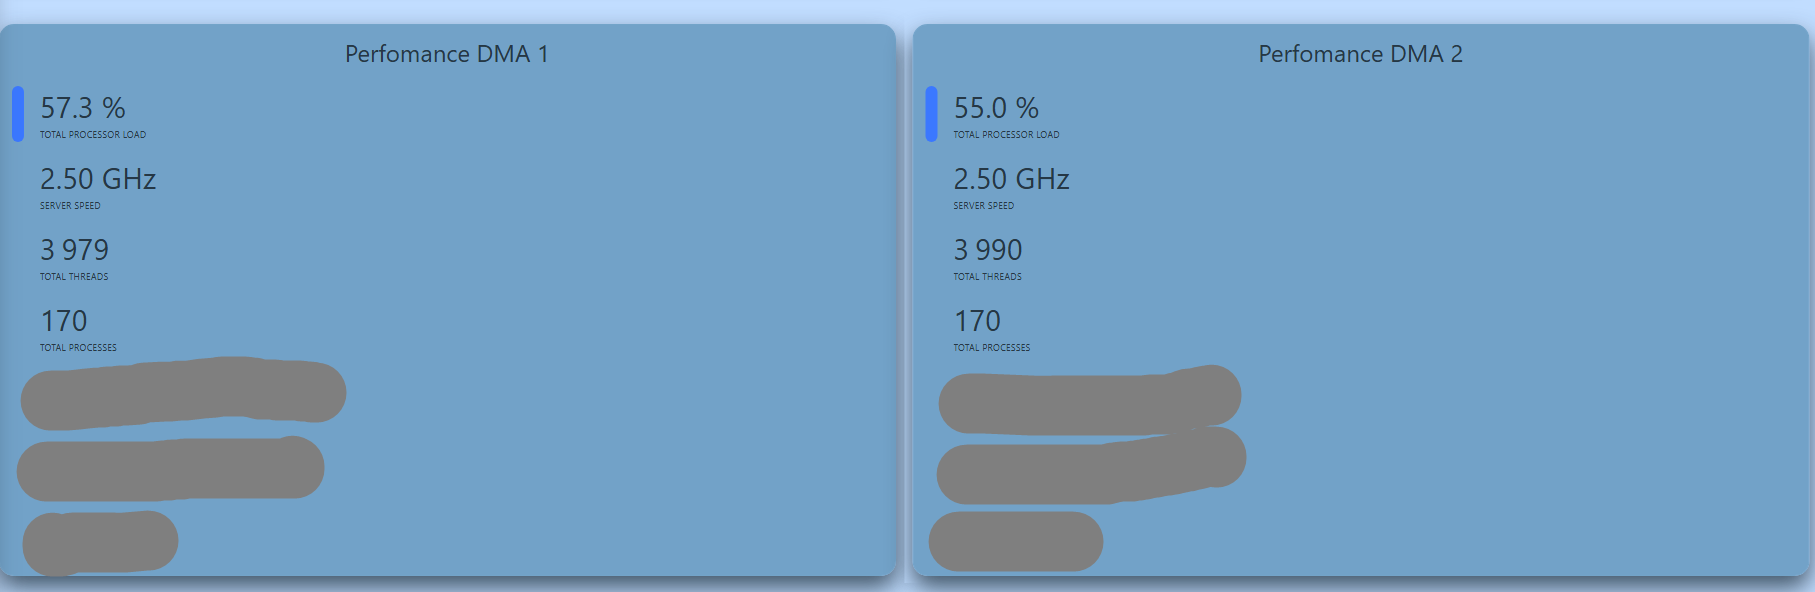
Please Find below a sample which I am trying to achieve.

Miguel Obregon [SLC] [DevOps Catalyst] Answered question 4th April 2025

1 Answer

  • Active
  • Voted
  • Newest
  • Oldest
2
Miguel Obregon [SLC] [DevOps Catalyst]18.99K Posted 4th April 2025 0 Comments

Hi Raghav,

If you plan to implement this visualization in a Visio overview, you could use Generate shapes for a predefined set of elements.

If you plan to implement this visualization in a dashboard/LCA, you could use a grid component. Using GQI queries you can retrieve information from elements using the Microsoft Platform connector(using the data source Get Elements) and their corresponding KPIs (using the data source Get parameters for elements where)

Hope it helps.

Miguel Obregon [SLC] [DevOps Catalyst] Answered question 4th April 2025
Please login to be able to comment or post an answer.

My DevOps rank

DevOps Members get more insights on their profile page.

My user earnings

0 Dojo credits

Spend your credits in our swag shop.

0 Reputation points

Boost your reputation, climb the leaderboard.

Promo banner DataMiner DevOps Professiona Program
DataMiner Integration Studio (DIS)
Empower Katas
Privacy Policy • Terms & Conditions • Contact

© 2025 Skyline Communications. All rights reserved.

DOJO Q&A widget

Can't find what you need?

? Explore the Q&A DataMiner Docs