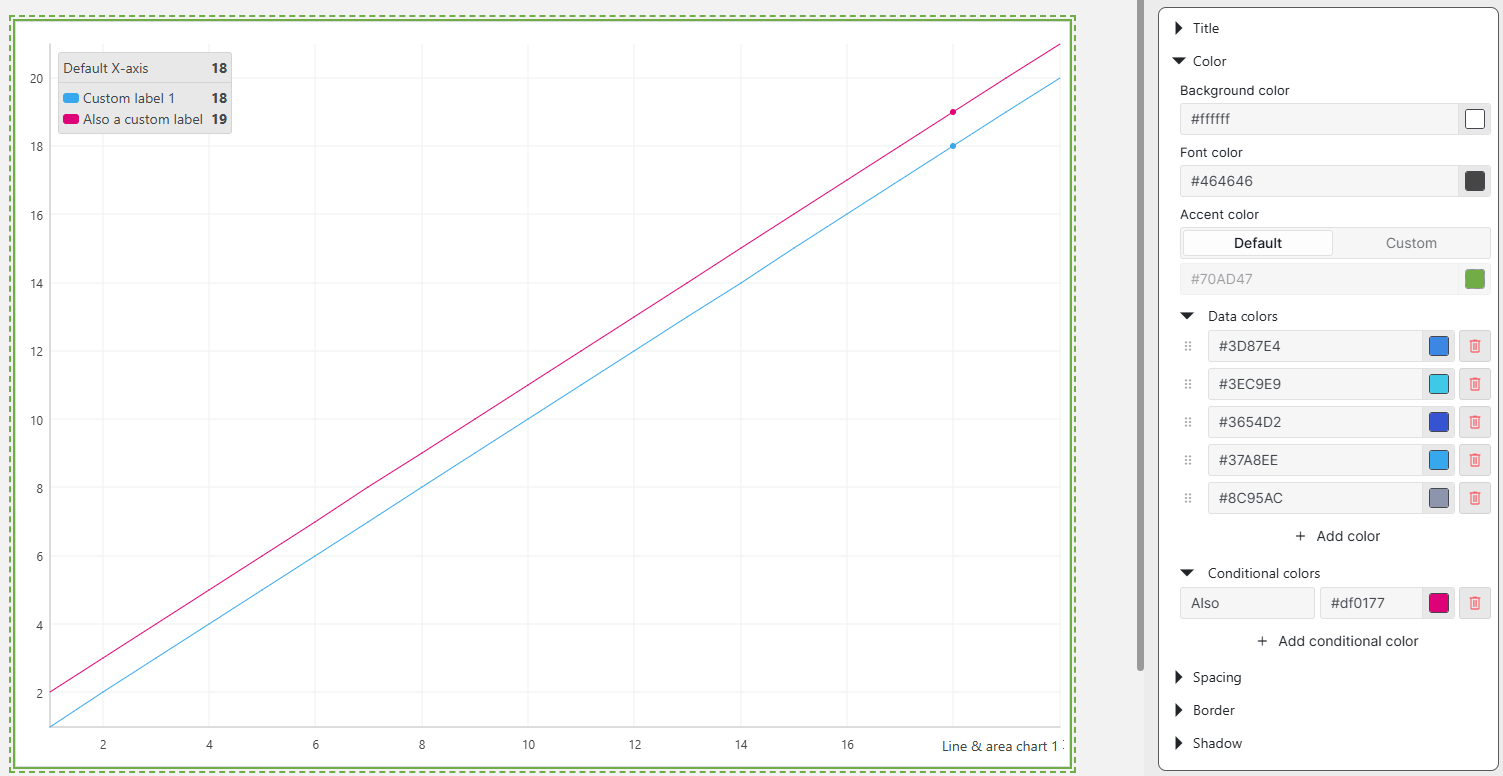
Hi, I have a dashboard with a ‘Line & area chart’ component. On this component I have 2 GQI queries with the same type of data, meaning that they should use the same x- and y-axis.
Is there a way to display both of them on the same component with different color lines and have the query name visible on the tooltip hover?

Dieter Pappens [SLC] [DevOps Member] Selected answer as best
Hi Dieter,
This is definitely possible using the ‘Line & area chart’ component.
- To display the lines using different colors, you have to customize the component theme. In the theme you can choose different data colors, that will be assigned in order. You can also choose a conditional color that will use the same color to all data that is matching a specific pattern.
- There is no way to customize the tooltip labels of the chart directly. The labels that are used for each line is to the name of the column that was chosen for the Y-values. To make these labels more clear, you can use a custom operator to rename the column.

Dieter Pappens [SLC] [DevOps Member] Selected answer as best