Dojo,
I'm using Dataminer to predict the Weather ( side quest ). Is it possible to have an overlay of the prediction against the actual trend in cube to see how they match up ?
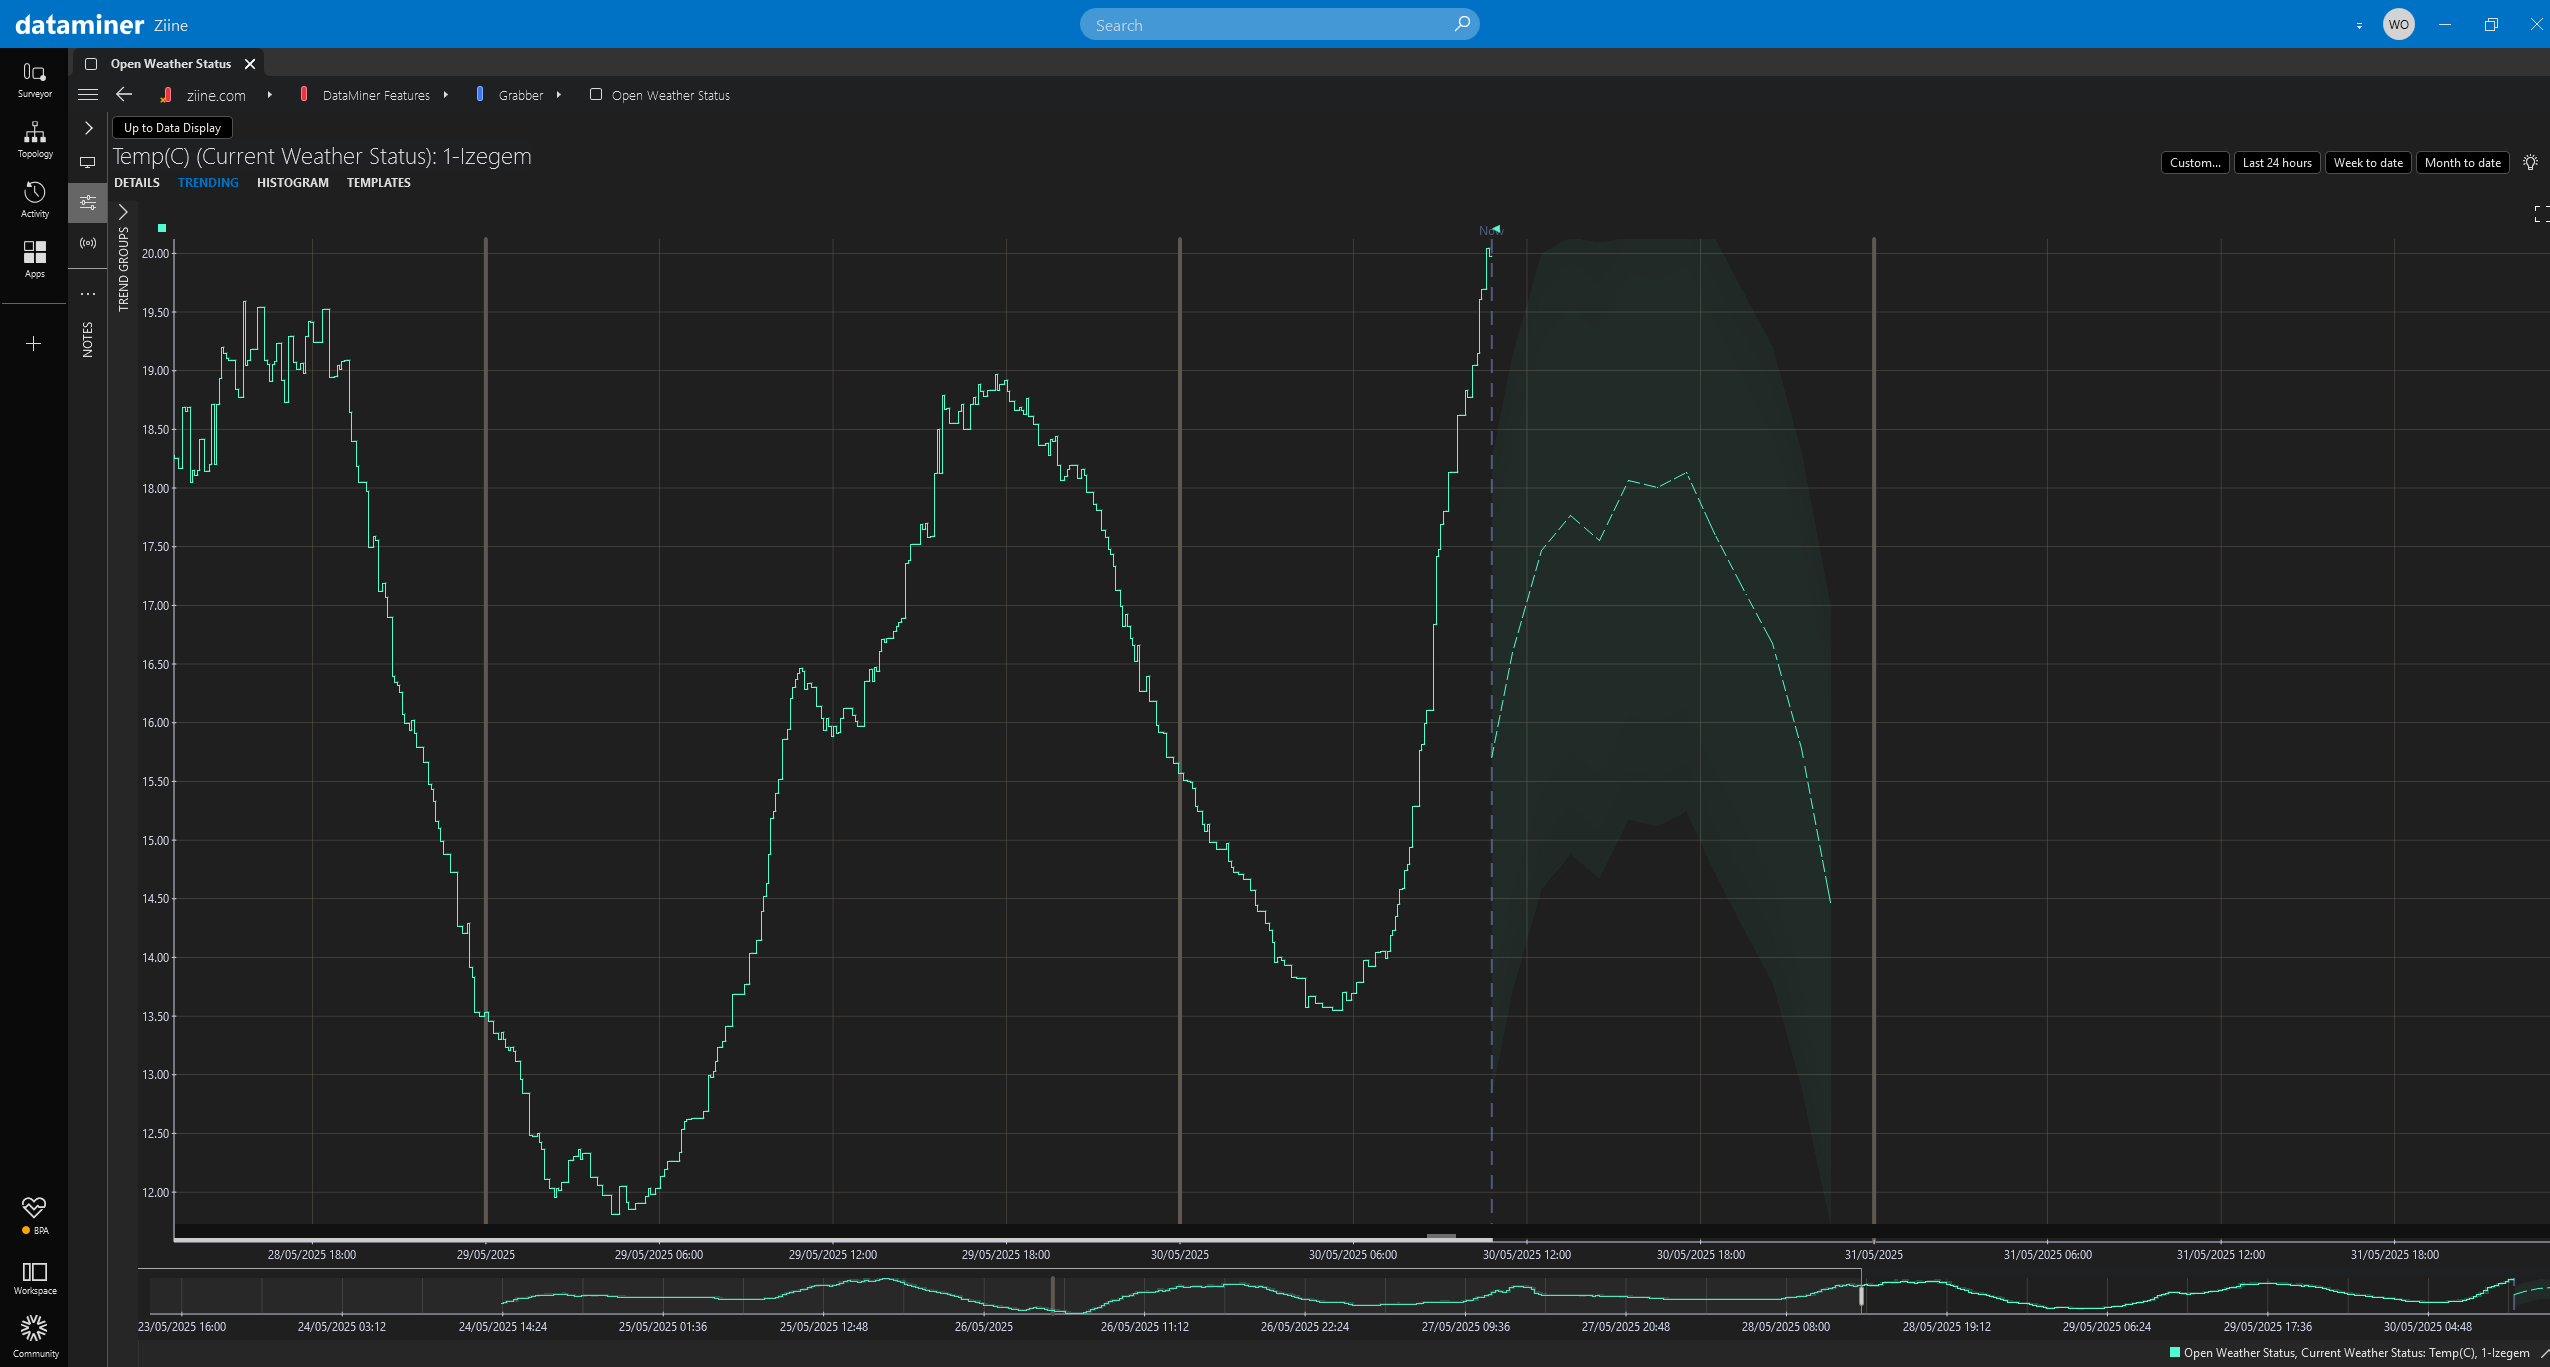
Hi Wale - no that is currently not possible, i.e. while we show the forecasted data, we do not retain it to then be able to see the delta (e.g. what was forecasted yesterday at 3PM and what was it then effectively).
Do note that you do not have the best use case at hand. This capability is geared towards detecting behavior in metrics and learning about that behavior (based on its past behavior - looking at that specific metric). Every metric has a certain level of predictability, if I can put like that. For example, the power utilization over time in my office will be fairly predictable, i.e. patterns will emerge and those are fairly likely going to apply in the future. The same goes for things like bandwidth utilization, number of online users, temperatures in facilities, and you name it (and depending on the details and the metric at hand, again, the degree of predictability will vary between those).
But there are also complex metrics, where the predictability is going to be very low (i.e. the past behavior says little about what it could become next), typically because it is part of an extremely complex overall ecosystem that impacts it (and you would have to be able to model that entire ecosystem in fairly great detail to be able to do forecasting) - examples would be the weather, stock prices, value of a bitcoin, etc. And this DataMiner capability is not geared towards that, and it would require tailored complex forecasting solutions to do this.
Note that DataMiner also features anomaly detection - that's again a different animal. In that case it is all about changes in behavior and to what extent it can be considered a so-called anomaly.