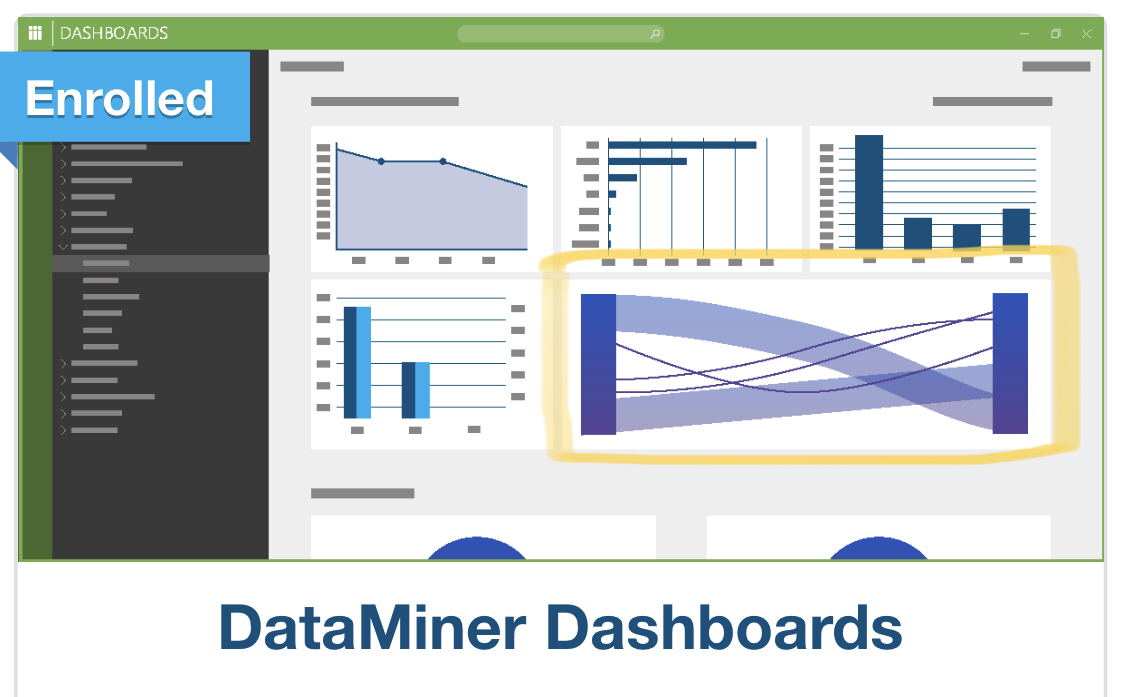
Hello all! I have seen the Sankey Diagram, as in the picture below, in some Dataminer materials, but could not find it in Dashboards App. How can I use it in Dataminer?

The Sankey visualization was indeed linked to a dashboards component which was the 'alpha' version of our GQI component. You can expect the Sankey visualization to come back at some point in time and that you will be able to link it to your GQI Queries.
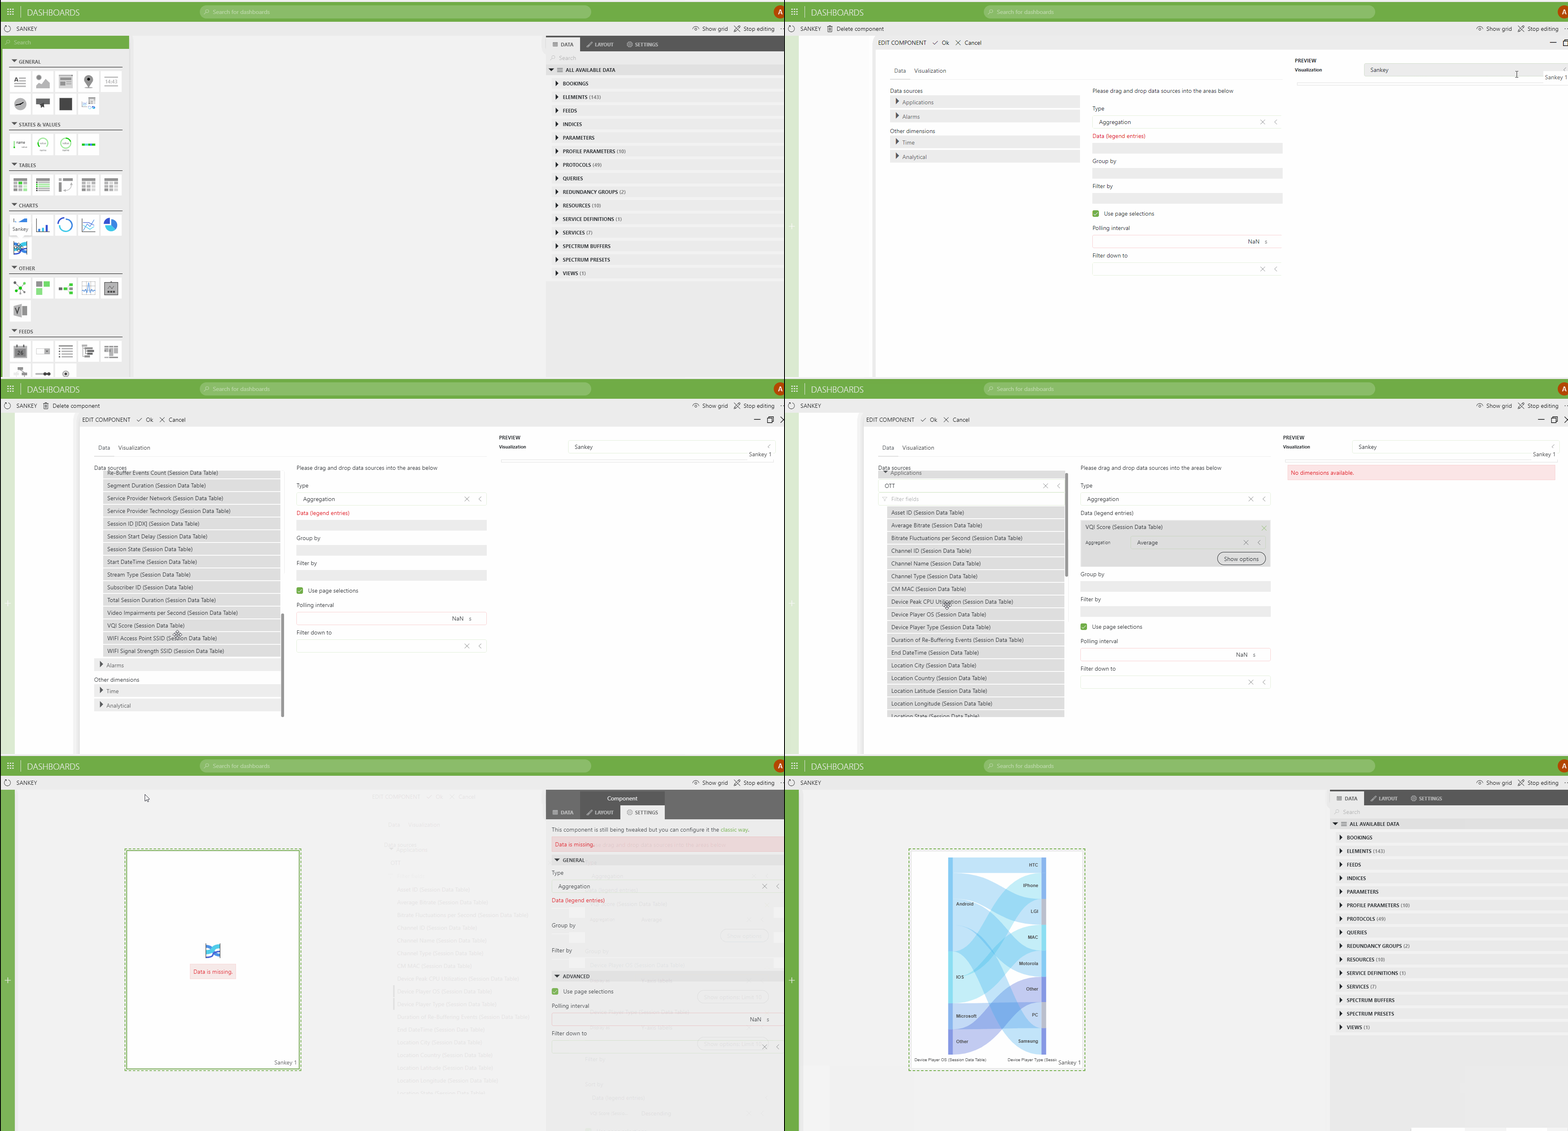
Nevertheless, if you want to use it 'as is' (alpha level quality), you can still enable the softlaunch option 'ReportsAndDashboardsAlpha' like Sebastiaan mentioned. A rather annoying requirement for that component to work is that the data needs to be available in Elastic Db. Therefore you need:
- a logger table (DataMiner Development Library)
- an alias in Elastic for that table
You can send an slnet message like the one below, but then with the correct IDs (DataMiner Development Library)

- 'Classic' config in dashboards (at the end of the config, you need a browser refresh)

Thank you Pieter! I was trying to figure out how to use and you explained very well.