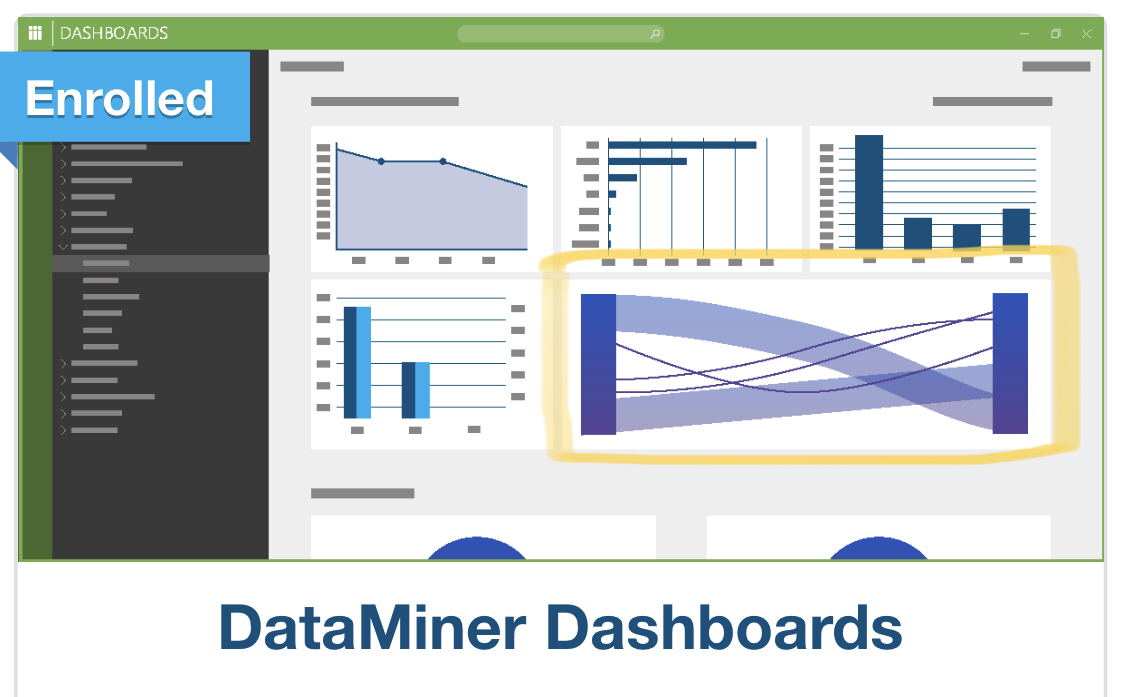
Hello all! I have seen the Sankey Diagram, as in the picture below, in some Dataminer materials, but could not find it in Dashboards App. How can I use it in Dataminer?

Hi Fabio,
The Sankey visualization has not been officially released and is currently still behind the 'ReportsAndDashboardsAlpha' soft launch flag. This means that some modifications may happen to it or that the feature might not even make it to an official release.
More information about soft launch flags and their configuration can be found in the documentation: soft launch options.
Thank you! I will give it a try!