Hey,
We created a dashboard using: "Node Edge Graph" to visualize the state of the network.
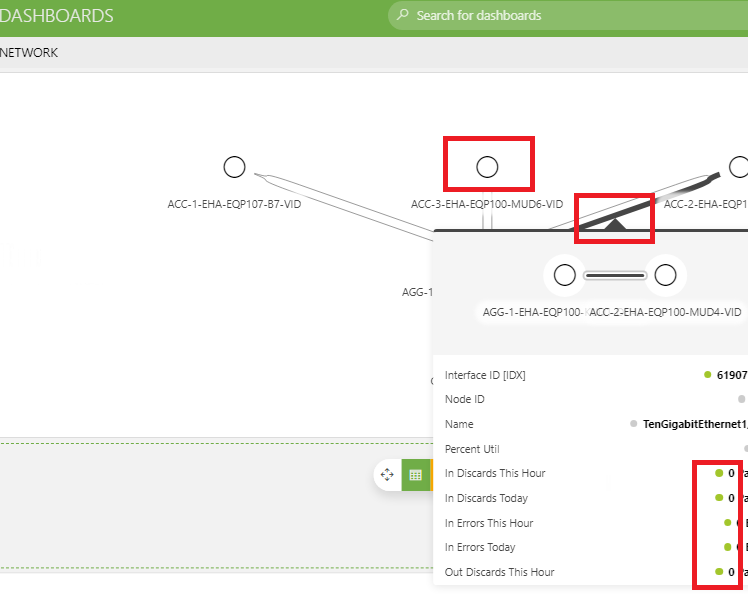
We would like the "Nodes" and "Lines" in the generated graph (See snapshot below) to inherit the colors of the parameters that it is representing.
Today using this dashboard the operators need to click on each Node \ Line to see if there are any errors \ alerts on it.
Thank you.
Marieke Goethals [SLC] [DevOps Catalyst] Selected answer as best
Hi Guy,
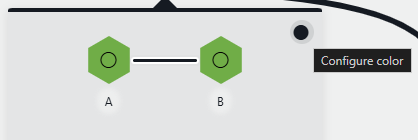
You can do so by clicking in the top-right corner of the pop-up:
Followed by setting the coloring to 'Alarm':
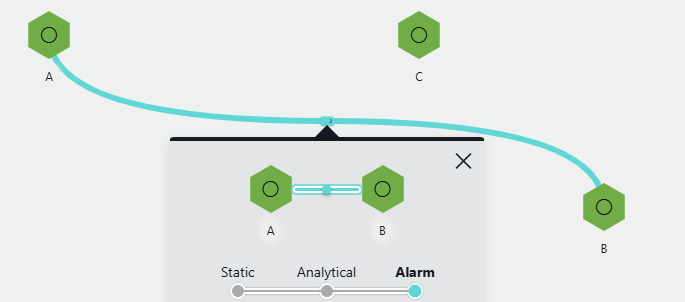
For the nodes, the approach will be similar, however, it’s important to note that this requires including an alarmed parameter as a column for the nodes.
Marieke Goethals [SLC] [DevOps Catalyst] Selected answer as best
Perfect. That is exactly what we were looking for.
Thank you for your help.