Hello,
I would like to have in a dashboard a list of services and their respective alarm status. Also, I want to show only the services that are under a certain selected view.
Is there a way to achieve this? I found that GQI queries allow filtering services but I couldn't find a filter for the parent view, nor a way to select the current alarm status of the services.
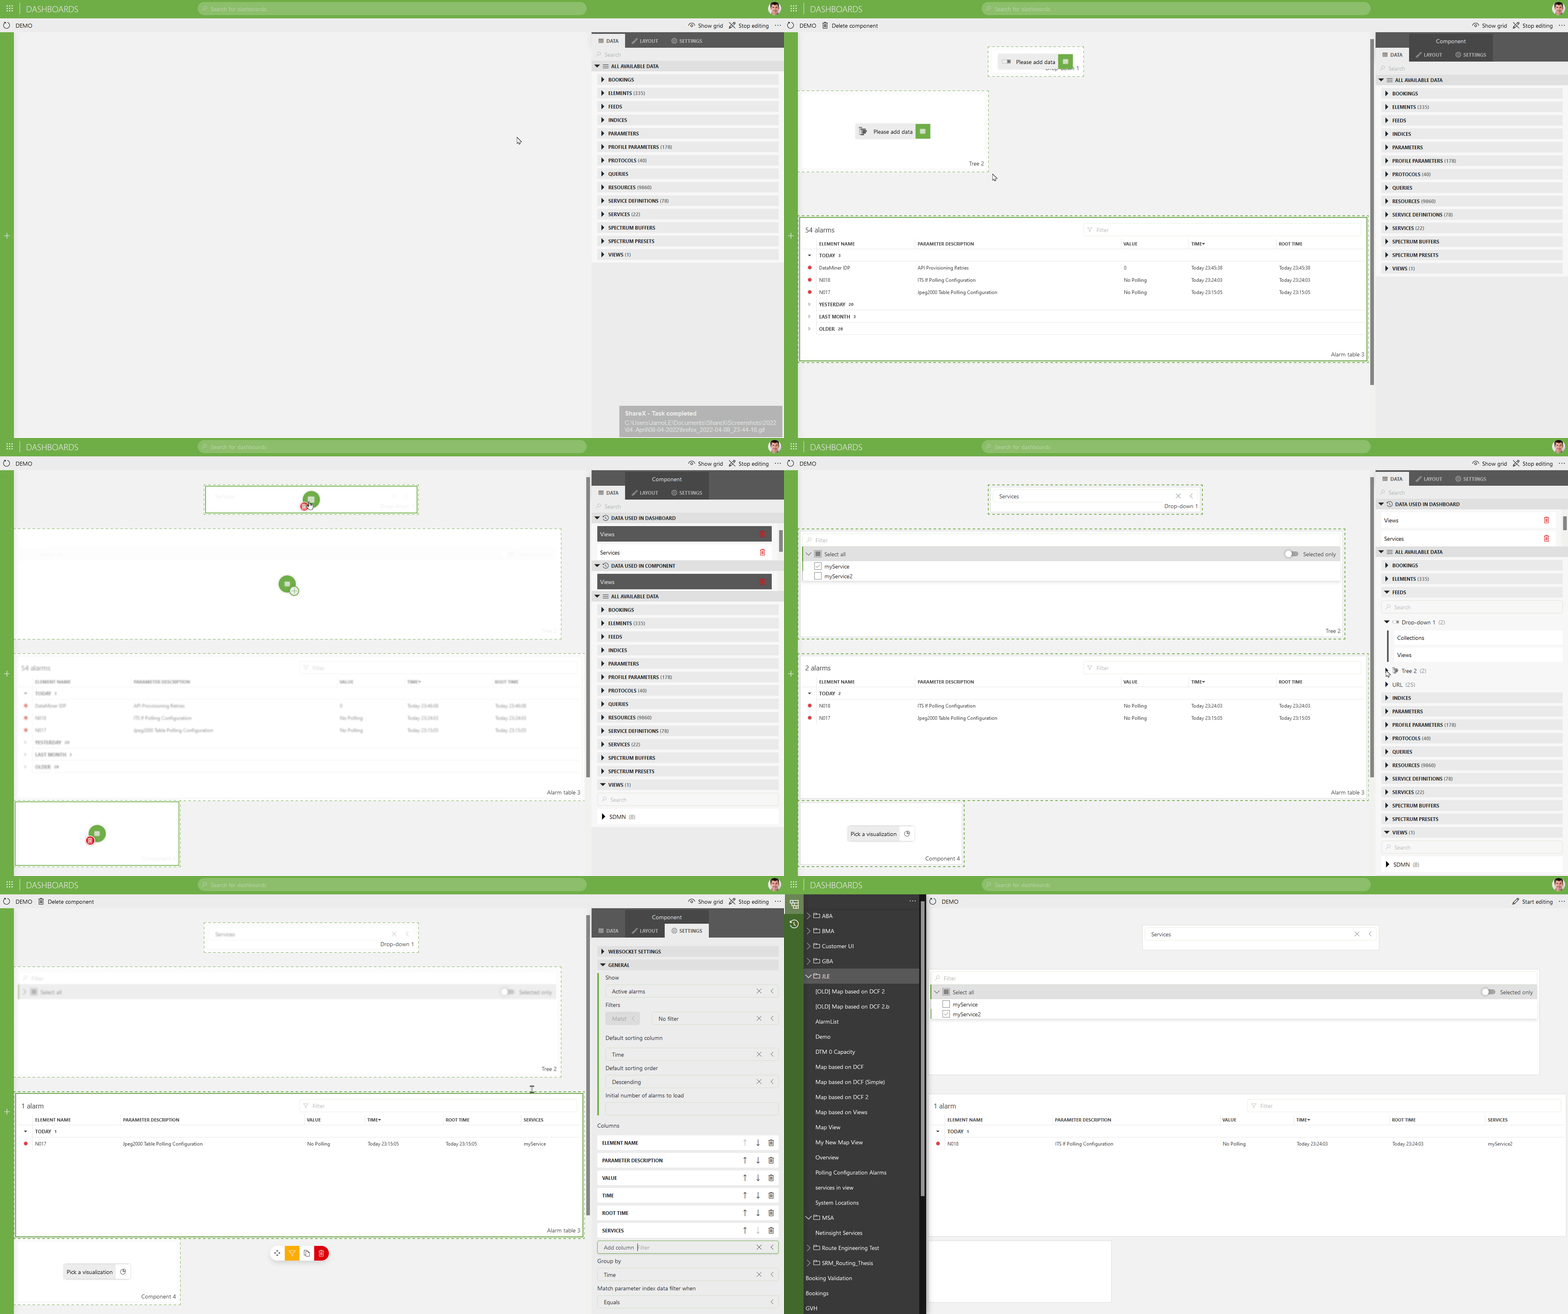
Hi Sebastian, I once created a quick dashboard with the standard components available, so just a matter of dragging and dropping. It will give you a dropdown of possible views. Upon selecting a view, it will show all services + a list of alarms, both filtered on the view. When selecting one or more services, the alarms are getting again filtered.

Not exactly what you were looking for, but maybe this is also an option.
Hi Sebastian – I guess it depends then on the type of services you have in your system. The regular services do not have alarms, they only have an alarm state that they inherit from the included resources at that point of time. An Enhanced Service however can have it’s own set of metrics, which can be in an alarm state, and which could be filtered out. This is also what Rene points out in his response.
Thank for the explanation Ben. I’m currently using regular services so based of what you said, I needed the alarm inherited from the resources.
Hi Jarno,
Thanks for the feedback and the explanatory GIF!
This is actually a good approach, however this will show ALL the alarms that belong to the services, including the alarms per child element.
I am looking for a higher level of alarm summary, where I see only the status of the services (I don’t care about the alarm element details).