Hello community,
Is it possible to group line charts that are generated using GQI in a single component? Either by adding pagination to a component or displaying multiple lines in a single chart?
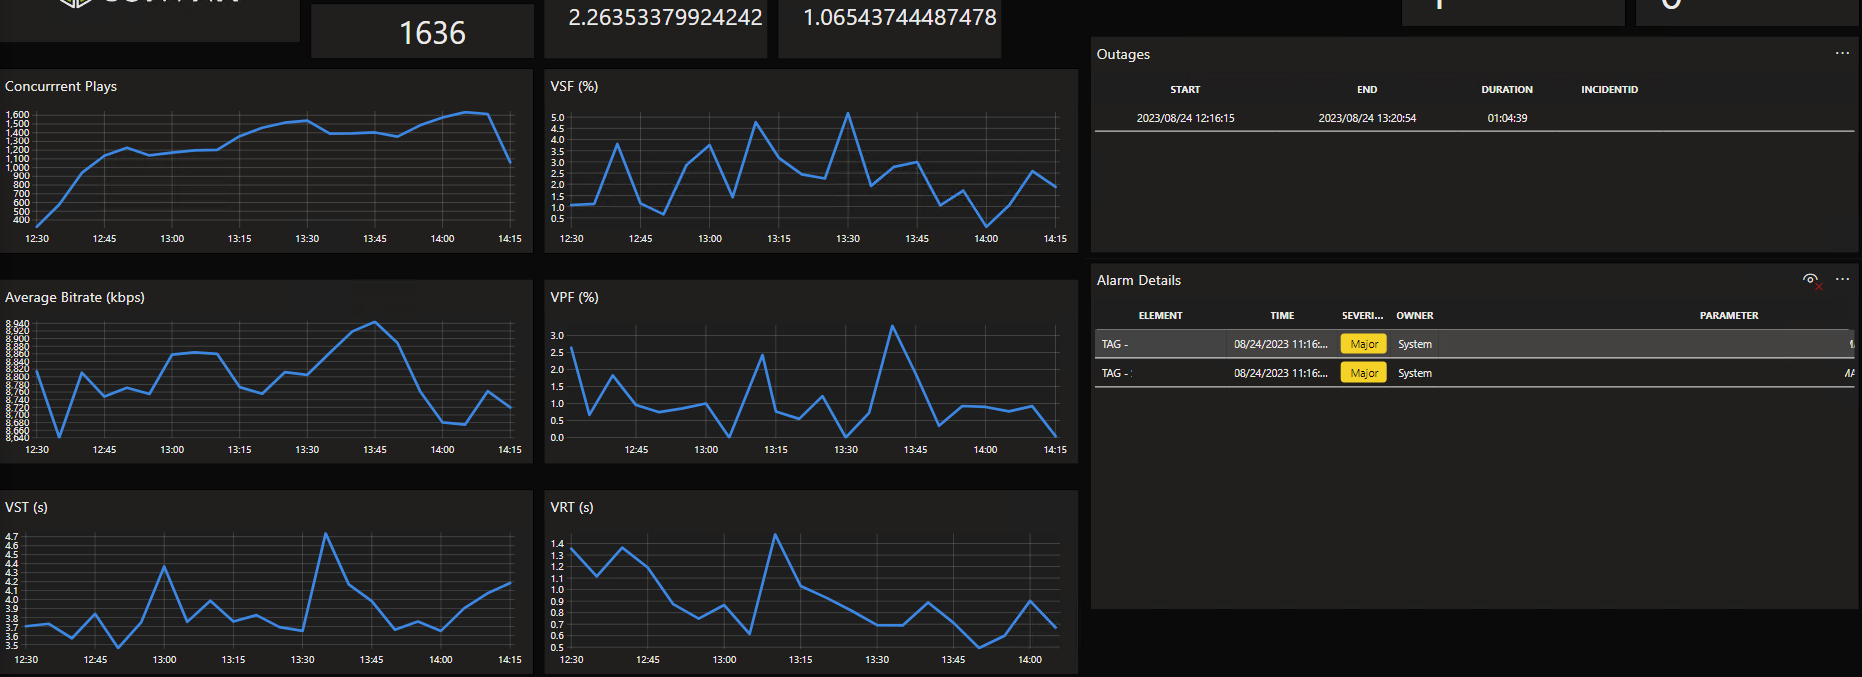
Currently I have the following view, and I would like to reduce the amount of space used by the charts in the dashboard:

Hi Sebastian,
As Miguel mentioned, this is not yet supported. Following task exists on our backlog to support multiple lines in a line chart when using GQI: https://collaboration.dataminer.services/task/188381
Best regards, Ward