Skip to content
DataMiner DoJo

More results...

Generic selectors
Exact matches only
Search in title
Search in content
Post Type Selectors
Search in posts
Search in pages
Search in posts
Search in pages
Log in
Menu
  • Blog
  • Questions
  • Learning
    • E-learning Courses
    • Open Classroom Training
    • Certification
      • DataMiner Fundamentals
      • DataMiner Configurator
      • DataMiner Automation
      • Scripts & Connectors Developer: HTTP Basics
      • Scripts & Connectors Developer: SNMP Basics
      • Visual Overview – Level 1
      • Verify a certificate
    • Tutorials
    • Video Library
    • Books We Like
    • >> Go to DataMiner Docs
  • Expert Center
    • Solutions & Use Cases
      • Solutions
      • Use Case Library
    • Markets & Industries
      • Media production
      • Government & defense
      • Content distribution
      • Service providers
      • Partners
      • OSS/BSS
    • DataMiner Insights
      • Security
      • Integration Studio
      • System Architecture
      • DataMiner Releases & Updates
      • DataMiner Apps
    • Agile
      • Agile Webspace
      • Everything Agile
        • The Agile Manifesto
        • Best Practices
        • Retro Recipes
      • Methodologies
        • The Scrum Framework
        • Kanban
        • Extreme Programming
      • Roles
        • The Product Owner
        • The Agile Coach
        • The Quality & UX Coach (QX)
    • DataMiner DevOps Professional Program
  • Downloads
  • More
    • Feature Suggestions
    • Climb the leaderboard!
    • Swag Shop
    • Contact
      • General Inquiries
      • DataMiner DevOps Support
      • Commercial Requests
    • Global Feedback Survey
  • PARTNERS
    • All Partners
    • Technology Partners
    • Strategic Partner Program
    • Deal Registration
  • >> Go to dataminer.services

Dashboard line & area chart showing real time and average trend points for same parameter.

Solved495 views26th August 2024Dashboard component line and area chart
3
Zhing Hang Lee672 21st May 2024 0 Comments

In dataminer I have a table column parameter that has enabled real time and average trending.

The real time data has configured to 24 hours.

In my dashboard, I am displaying a line and area chart of the parameter so that user can see the trending of the graph.

My questions is: Is it possible to have the chart showing 24 hours real time value combine with average value before the 24 hour?

Currently I have the chart settings Trend points - real time. And the chart shows real time accurately. However, the user is also allowed to change the timespan to monitor longer history values. But when change the timespan to more than 24 hours the chart shows no result.

Is there a way I can combine real time value and average value for a single column parameter in 1 chart?

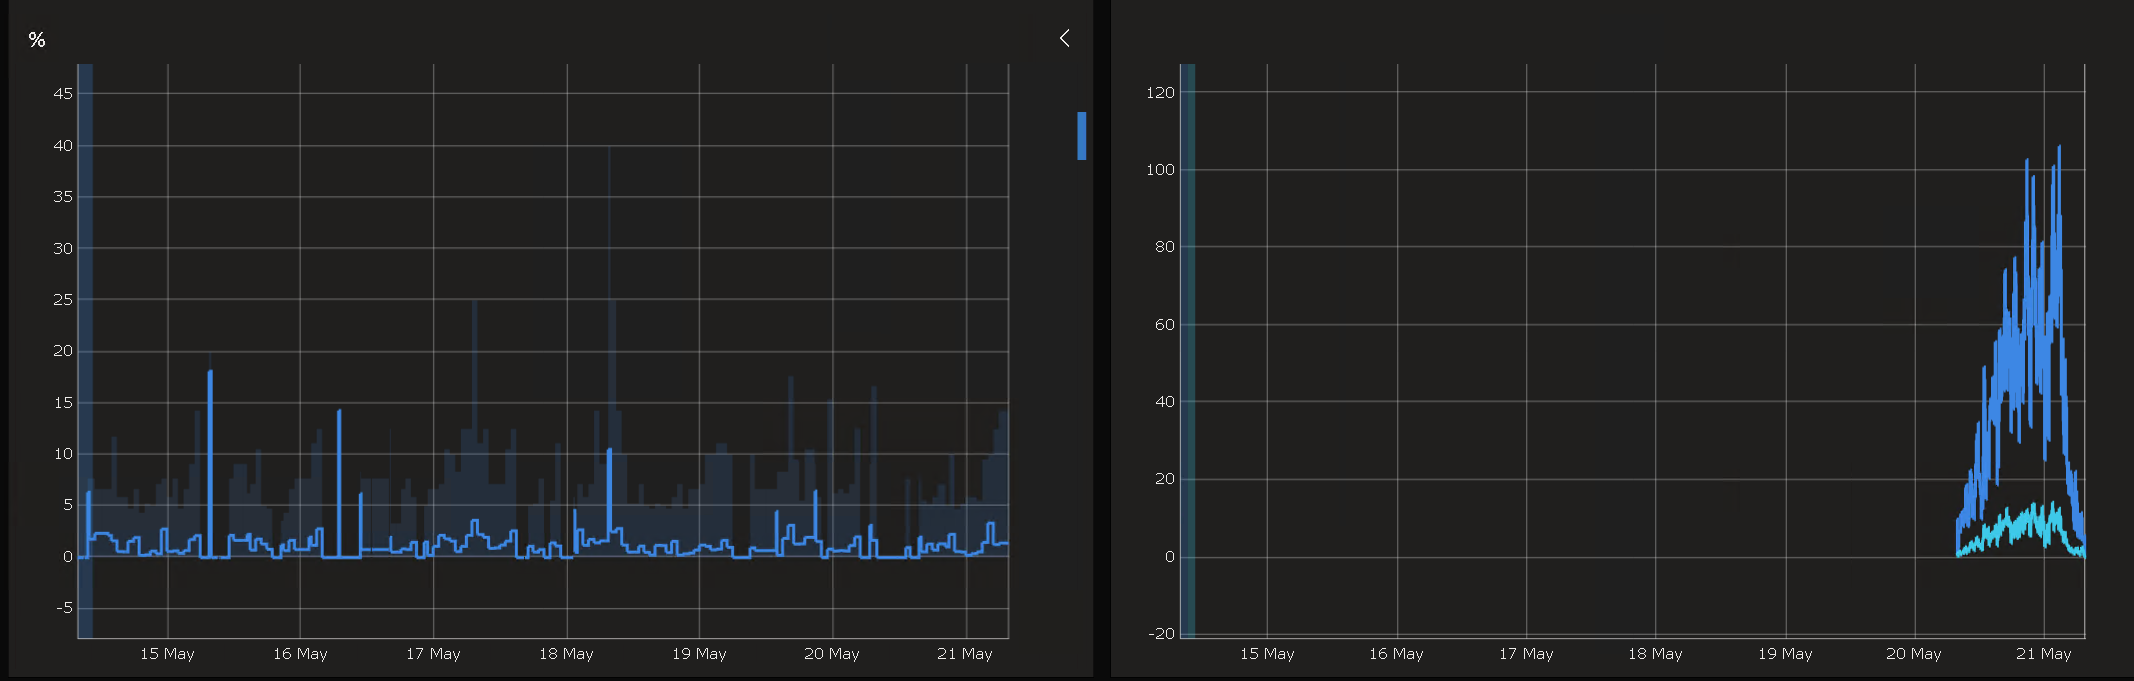
Chart left shows average value, chart right shows real time value (both with timespan of last 7 days)

Marieke Goethals [SLC] [DevOps Catalyst] Selected answer as best 26th August 2024

1 Answer

  • Active
  • Voted
  • Newest
  • Oldest
2
Wout Mahieu [SLC] [DevOps Catalyst]7.47K Posted 21st May 2024 0 Comments

Hi Zhing Hang,

Unfortunately this cannot be done using a parameter as data in the line chart component. This configuration can be achieved using the same component with queries starting from DataMiner 10.3.0[CU15]/10.4.0[CU3]/10.4.6 onwards.

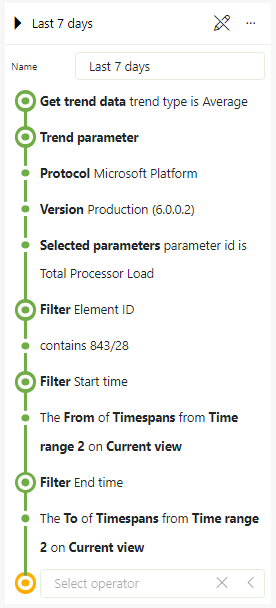
First you will need 2 time range components to use as a feed in your queries.

  • One with default range 'last 24 hours'
  • One with default range 'last 7 days'

Then you can create 2 queries that each fetch part of the data using the 'Get trend data' source.

  • One with real-time date & the time filtered on the 'To' and 'From' feeds of the first time range
  • One with average date & the time filtered on the 'To' and 'From' feeds of the second time range

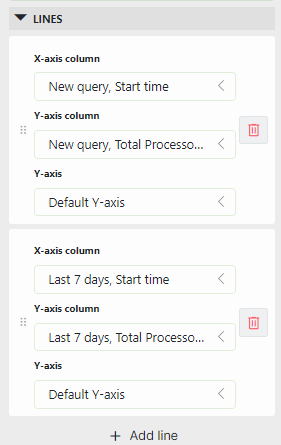
These queries can then be added to the line chart component and 2 lines can be configured. The first line will show the real-time data for the last 24 hours. the other line will show the average data for the last 7 days. Note that these lines will overlap since there is no 'Last 7 days - last 24 hours' option in the time range component. The colors of the lines can be configured using the color palette of the component/dashboard.

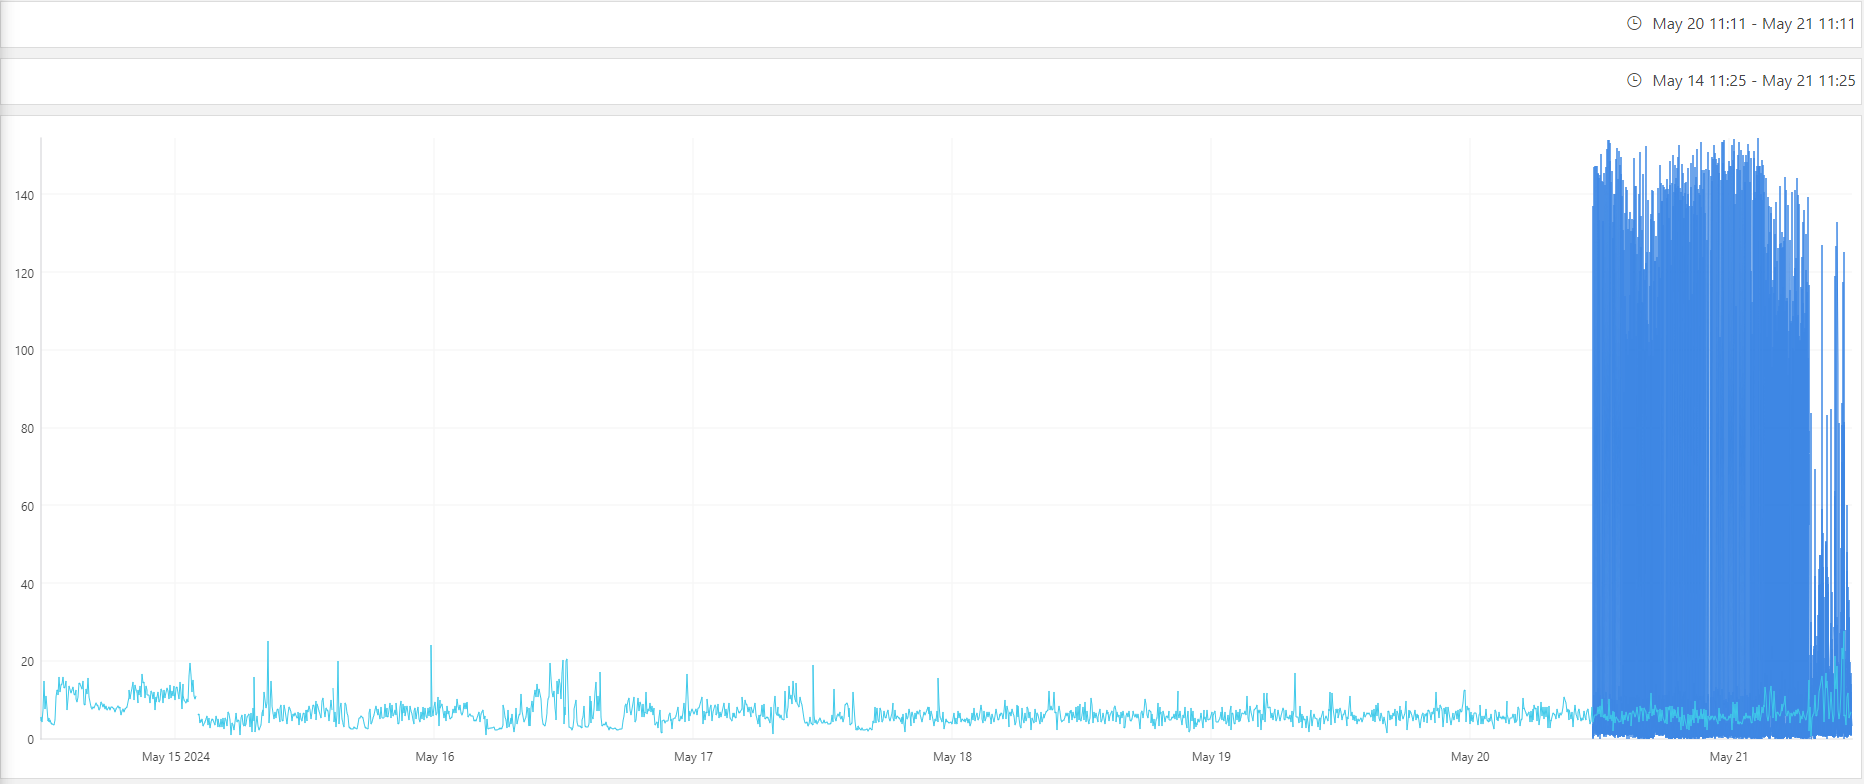
In the end, you will get a dashboard like this:

Alternatively, you could create an ad hoc data source that returns the desired points. This way, there is no need for the time range components & the 2 lines will not overlap. The ad hoc source can also define an input argument for the parameter that can be linked to a feed, which the built in 'get trend data' source cannot do.

Marieke Goethals [SLC] [DevOps Catalyst] Selected answer as best 26th August 2024
Please login to be able to comment or post an answer.

My DevOps rank

DevOps Members get more insights on their profile page.

My user earnings

0 Dojo credits

Spend your credits in our swag shop.

0 Reputation points

Boost your reputation, climb the leaderboard.

Promo banner DataMiner DevOps Professiona Program
DataMiner Integration Studio (DIS)
Empower Katas

Recent questions

Correlation Engine: “Test rule” doesn’t result in a hit, despite functional rule 1 Answer | 3 Votes
When using the Setter = true attribute, will the copy action always be executed first? 1 Answer | 3 Votes
Multiple Set on Table parameters for DVE’s 1 Answer | 2 Votes

Question Tags

adl2099 (115) alarm (62) Alarm Console (82) alarms (100) alarm template (83) Automation (223) automation scipt (111) Automation script (167) backup (71) Cassandra (180) Connector (109) Correlation (69) Correlation rule (52) Cube (150) Dashboard (194) Dashboards (188) database (83) DataMiner Cube (57) DIS (81) DMS (71) DOM (140) driver (65) DVE (56) Elastic (83) Elasticsearch (115) elements (80) Failover (104) GQI (159) HTTP (76) IDP (74) LCA (152) low code app (166) low code apps (93) lowcodeapps (75) MySQL (53) protocol (203) QAction (83) security (88) SNMP (86) SRM (337) table (54) trending (87) upgrade (62) Visio (539) Visual Overview (345)
Privacy Policy • Terms & Conditions • Contact

© 2025 Skyline Communications. All rights reserved.

DOJO Q&A widget

Can't find what you need?

? Explore the Q&A DataMiner Docs

[ Placeholder content for popup link ] WordPress Download Manager - Best Download Management Plugin