Hi Dojo,
I’m trying to create a dashboard for a single service, but this service is linked on different destinations. For each destination we have a service.
Current bar chart generated with query:
As you can see we have the same week for different services. Is it possible to make a bar chart like this:
This is the current data table:
How could I group the weeks and have than two columns for each service availability (history)?
Is this however possible to do?
Automation script:
Hi Stefan,
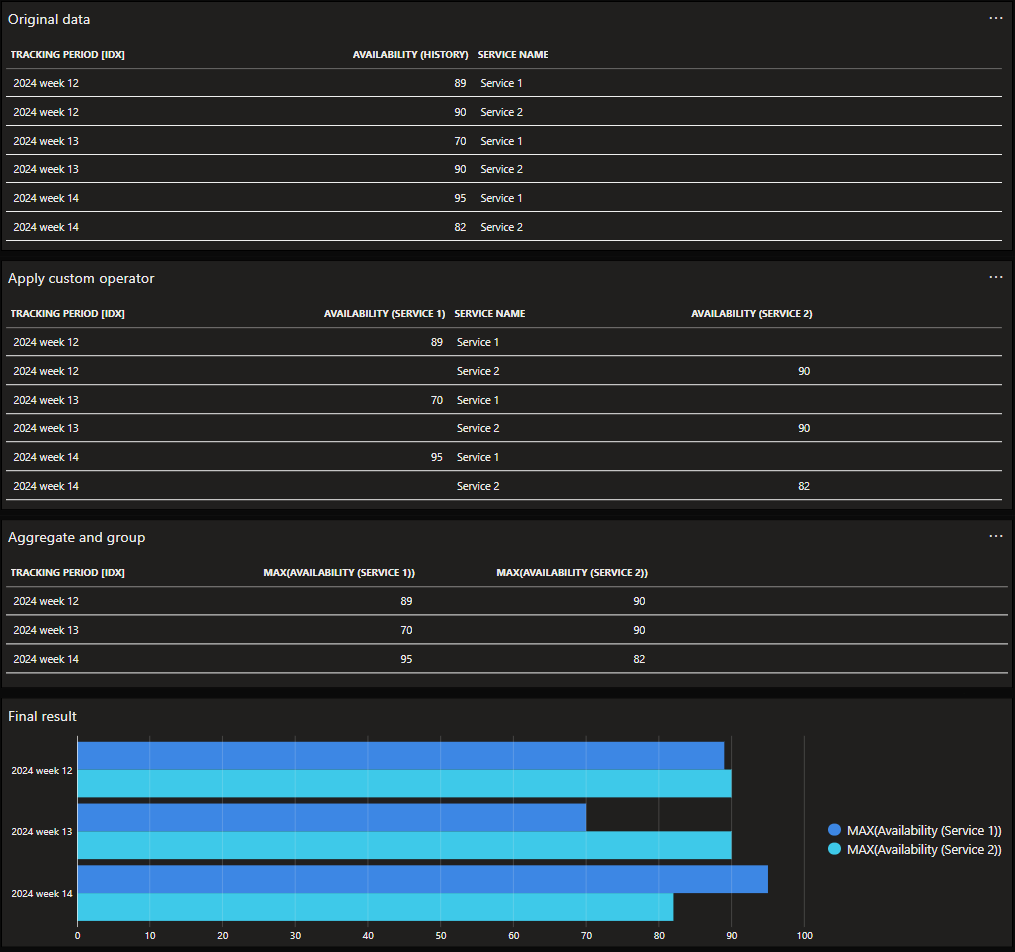
In order to get a bar chart like that, the availability of each service will have to be put into a separate column.
There is no trivial solution to do this yet, but it’s definitely achievable.
The data you currently have can be converted like this:
- Create and append a Custom Operator the query that does the following:
- Add a new column where you can put the availability of “Service 2”
- Read the values from the “Service Name” column
- If the value is “Service 2”
- copy the value from the original column to your new availability column
- clear the value from the original column
- Aggregate the data in your query:
- Take the maximum of the original availability column
- Take the maximum of the new availability column
- Group by the “Tracking Period” (i.e. column that will contain the label)
In the bar chart settings, you should now be able to select both availability columns to show up as separate bars on the chart.
I’ve put together a quick mock example of the process:
 Let us know if you have any more concerns or need additional help.
We hope to offer more straightforward solutions for use cases like this soon!
Hi Stefan, there could be a few reasons for that.
First of all, depending on which DataMiner version you have, you might need to enable the soft launch option (see link in the answer).
Secondly, on the automation script, did you check the Advanced > “Compile as library with name” option?
Note: You can also configure this in VS by adding the following in the tag in the automation script XML:
true
MyLibraryName
Let me know if any of these steps solved your issue.
If not we’ll have to dig a little deeper.
Hi Ronald,
I have checked it and compile as library is set. On my question I added a screenshot. Maybe the name is the problem?
Our DMA version is: DataMiner (10.3.0.0-13999-CU12)
The name looks fine, and the DataMiner version too.
Do you get any errors or warnings when you click the “Validate” link below the C# code block in your automation script?
If it compiled correctly, you should also be able to find the library file in folder C:\Skyline DataMiner\Scripts\Libraries, named: your-script-name.your-library-name.date.R.dll
Hi Ronald,
thanks for your help! I got it working like you described it!
Best regards,
Stefan
Hi Ronald,
many thanks for your detailed answer. I have created now my first GQI Custom Operator. I have published it via VS and I can see it as an automation script in Dataminer. But I don’t see it as an operator in queries. What step I have missed here to see the operator in the Dashboard?