Hello Dojo,
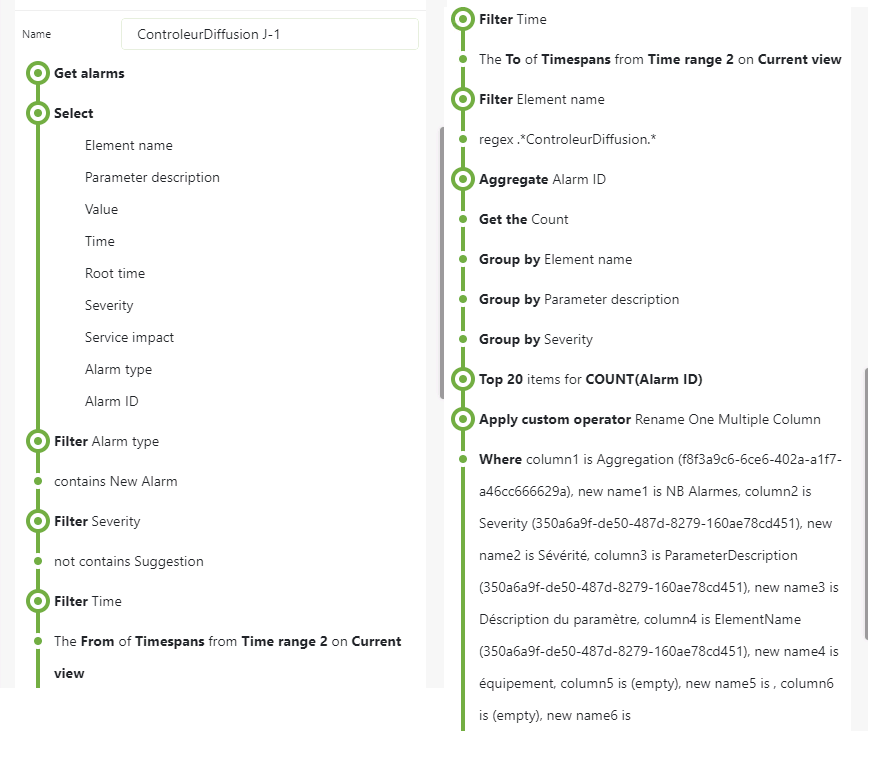
I'm trying to create a dashboard to retrieve the top 20 alarms for every parameter containing "ControleurDiffusion". I would like to get this information for the last 24 hours, 48 hours, and the last 7 days.
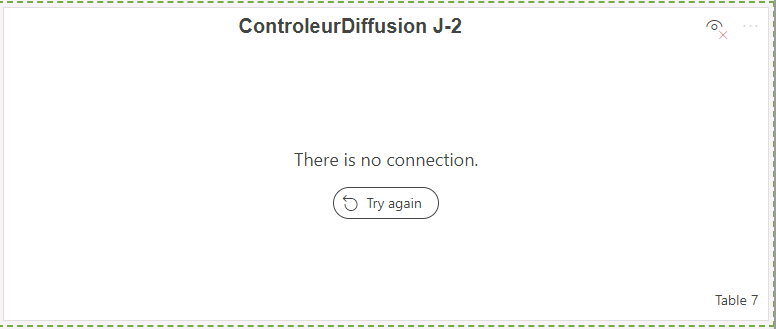
For the last 24 hours, it takes up to 5 minutes, and I can see the data. However, for the last 48 hours and the last 7 days, I get a message saying "There is no connection".
I'd like to know if there is a problem with the configuration of my queries or if this happens because there is too much data to process. If this is the case, is there any workaround for my issue?
Thank you for your help.
Here is my querie (the other queries are using a different Time range component) :
Error Message : 
Hi Alexander,
For this type of use case I would recommend to use the Data Aggregator DxM. This application allows you to run GQI queries at scheduled times. For example, you could run this query every day at midnight so results can be ready by the time that you open the dashboard in the morning. Data Aggregator will store the results in a CSV that can be processed by a ad-hoc data source and displayed in a dashboard/LCA. The drawback of this approach is that the results of the GQI query will be updated every 24 hours (in this particular example).
Hope it helps.
Hello Miguel,
Thank you for your answer. Unfortunately, my DMS is not cloud-connected. Indeed, this would be a good solution otherwise, and the query being updated every 24 hours wouldn’t be an issue.