Hi Dojo,
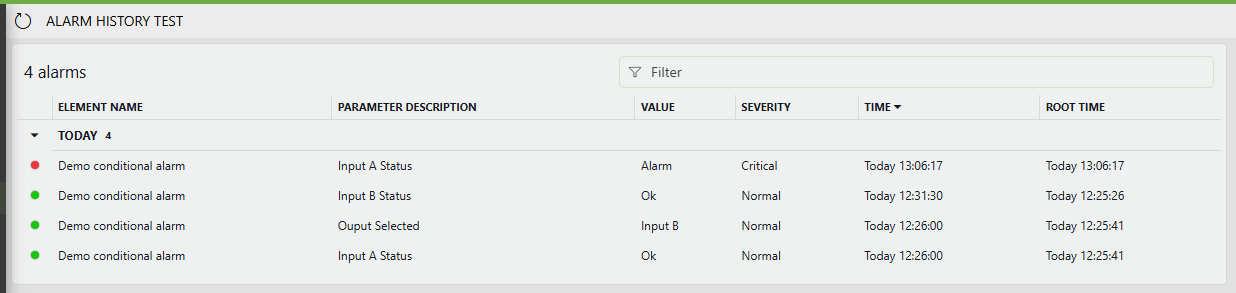
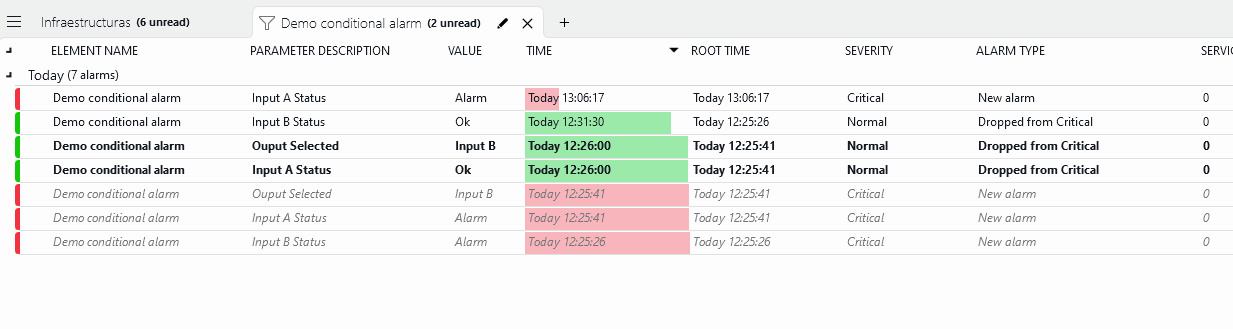
I'm configuring a Dashboard to generate a daily 24h history alarms report of a element. I'm using an "Alarm table" component configured as "History alarms" with a Timespam of "Last 24 hous" but I can't get the same behavior as in the alarm console. It only show final status of the alarm, I mean, for a cleared alarm, only show one entry, the Normal severity but It doesn't show the Critical senvery in te table like in the alarm console. See the differences:
I know I can do it using GQI, but is there any way to do it with the "Alarm table" component, which is supposed to be used for this purpose?
Hi Fernando, Hope you are doing well.
I believe GQI is going to be the way to go.
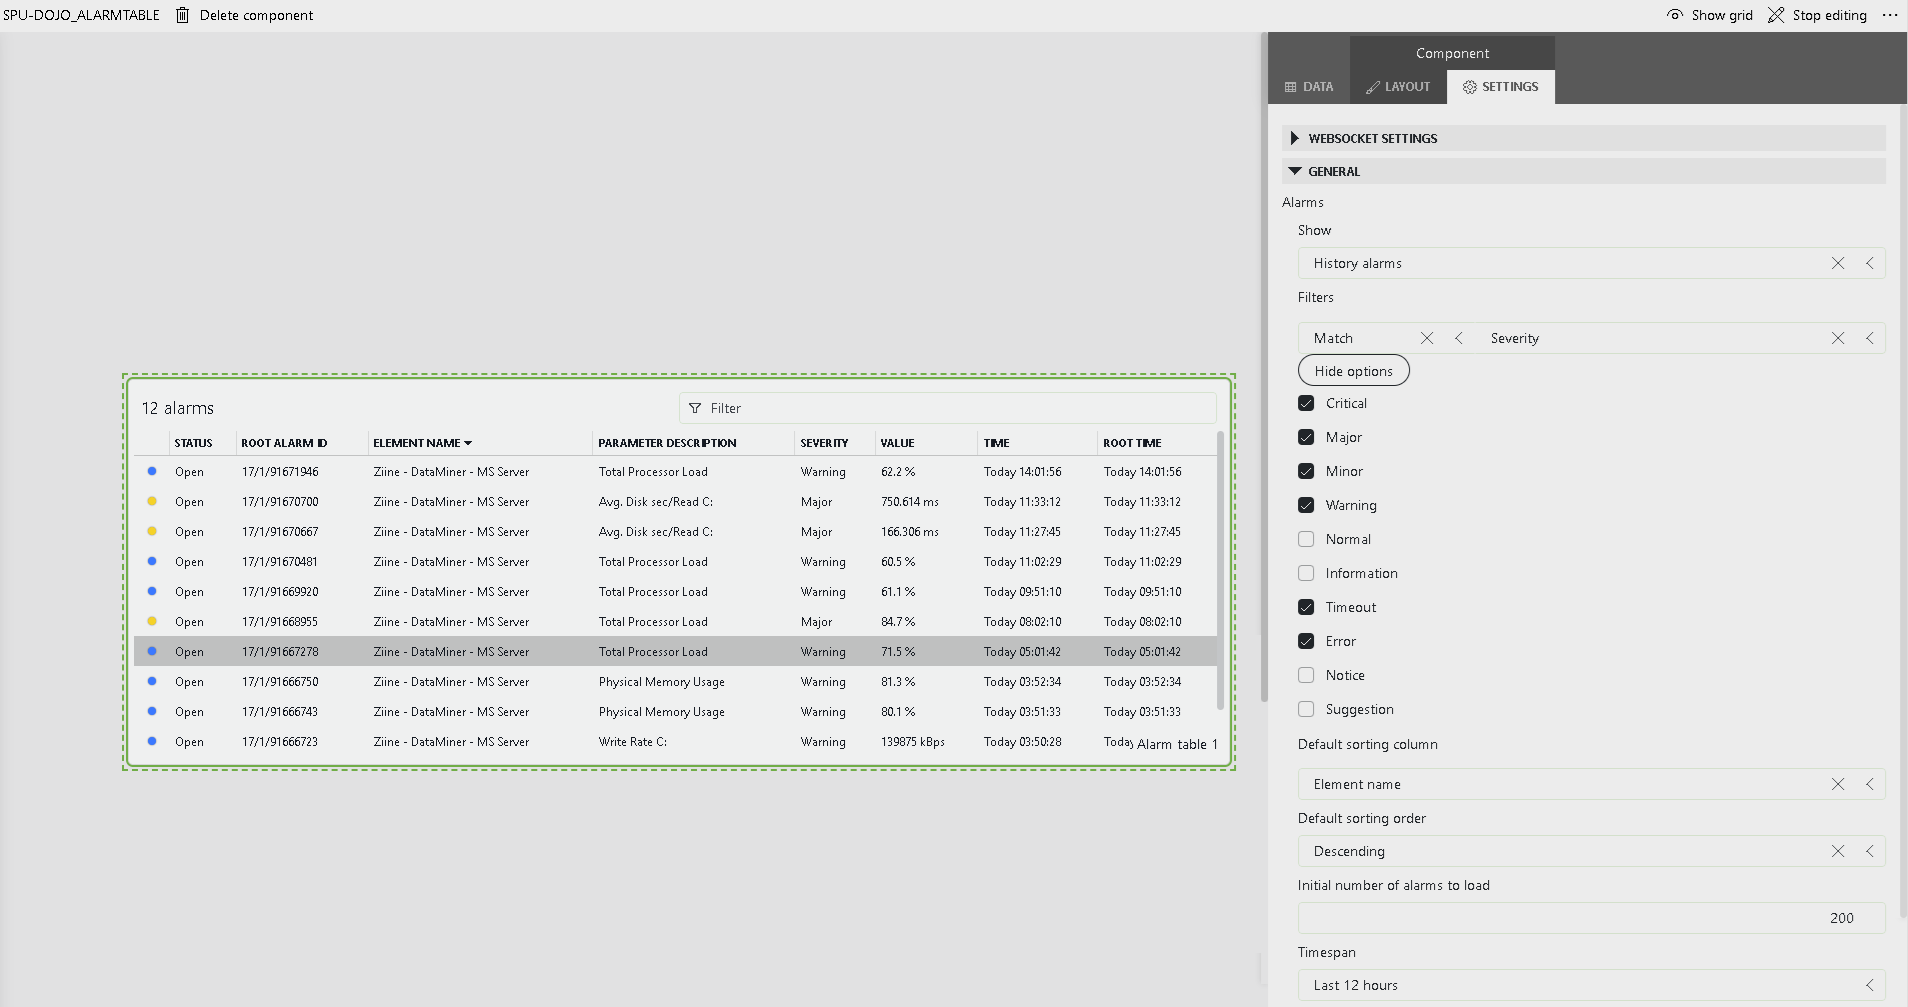
I was able to reproduce what you are seeing. It seems if 'Normal' is included in the Severity filter set all other alarm severities are ignored.
If you are only interested in the raised alarm severity, you can set the Filters to match all severities except 'Normal' then you will see the raised alarm entries.
Hope this helps.