Hello Dojo Community,
Thanks for the fantastic help the other day with integrating alarm filters into DataMiner Dashboards for complex queries! That guidance was really useful.
My Current Challenge: Counting Correlated Alarms in Dashboards & Reports
I'm now working on a use case that involves the correlation engine, specifically needing to count and present the number of correlated alarms within a historical search period.
I have a filter set up in the Alarm Console that successfully filters alarms based on a specific value (similar to Figure 1, where alarms are filtered by a custom "value" or string in their description). I saved this as an Alarm Focus filter.
My goal is to:
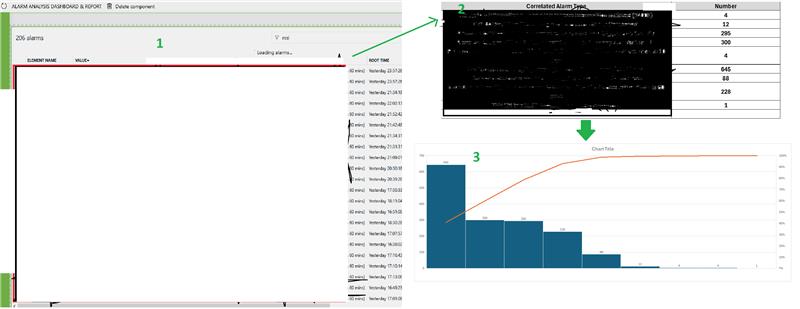
- Get a summary count of these filtered alarms displayed somewhere prominent on my dashboard (as depicted conceptually in Figure 2).
- Have this data presented with aggregation functions within the Report module (like Figure 3 suggests for aggregated views).
I've explored the query options in both modules, but it's not immediately apparent how to directly leverage my saved Alarm Focus filter for these specific counting and aggregation needs, especially for historical data.
Could someone please steer me on how I need to approach this? Specifically:
- How can I apply my saved Alarm Focus filter to get a count of active/historical alarms on a Dashboard widget (like a simple counter)?
- What's the best way to incorporate this saved filter into the Report module's historical alarm query, and then use aggregation functions (e.g., grouping by correlation type, or counting specific elements within the correlated alarms) to achieve a summary like Figure 3?
Any insights, examples, or pointers to specific documentation would be greatly appreciated!
Thanks in advance for your continued support!
Best regards,
Samson
A nice use case that warrants a more in-depth analysis. I would suggest reaching out to your contact at Skyline to see how we can help in bringing this to fruition in close collaboration with you.
Trying to get this to the right result on here would probably take ages.