Skip to content
DataMiner DoJo

More results...

Generic selectors
Exact matches only
Search in title
Search in content
Post Type Selectors
Search in posts
Search in pages
Search in posts
Search in pages
Log in
Menu
  • Blog
  • Questions
  • Learning
    • E-learning Courses
    • Open Classroom Training
    • Certification
      • DataMiner Fundamentals
      • DataMiner Configurator
      • DataMiner Automation
      • Scripts & Connectors Developer: HTTP Basics
      • Scripts & Connectors Developer: SNMP Basics
      • Visual Overview – Level 1
      • Verify a certificate
    • Tutorials
    • Video Library
    • Books We Like
    • >> Go to DataMiner Docs
  • Expert Center
    • Solutions & Use Cases
      • Solutions
      • Use Case Library
    • Markets & Industries
      • Media production
      • Government & defense
      • Content distribution
      • Service providers
      • Partners
      • OSS/BSS
    • DataMiner Insights
      • Security
      • Integration Studio
      • System Architecture
      • DataMiner Releases & Updates
      • DataMiner Apps
    • Agile
      • Agile Webspace
      • Everything Agile
        • The Agile Manifesto
        • Best Practices
        • Retro Recipes
      • Methodologies
        • The Scrum Framework
        • Kanban
        • Extreme Programming
      • Roles
        • The Product Owner
        • The Agile Coach
        • The Quality & UX Coach (QX)
    • DataMiner DevOps Professional Program
  • Downloads
  • More
    • Feature Suggestions
    • Climb the leaderboard!
    • Swag Shop
    • Contact
      • General Inquiries
      • DataMiner DevOps Support
      • Commercial Requests
    • Global Feedback Survey
  • PARTNERS
    • All Partners
    • Technology Partners
    • Strategic Partner Program
    • Deal Registration
  • >> Go to dataminer.services

converting reports to dashboards – alarm distribution graphs

Solved751 views26th July 2022Dashboard
1
Jeroen Geldhof [SLC] [DevOps Enabler]5.04K 20th July 2022 0 Comments

Since the reports and dashboards will go EOL, what's the best way to generate an alarm distribution or scatter graph in the new Dashboards?
Is there a way of displaying the elements/services with the most alarms or that have been the longest in alarm?

Jeroen Geldhof [SLC] [DevOps Enabler] Selected answer as best 26th July 2022

1 Answer

  • Active
  • Voted
  • Newest
  • Oldest
2
Ward Haeck [SLC] [DevOps Enabler]3.52K Posted 25th July 2022 1 Comment

Hi Jeroen,

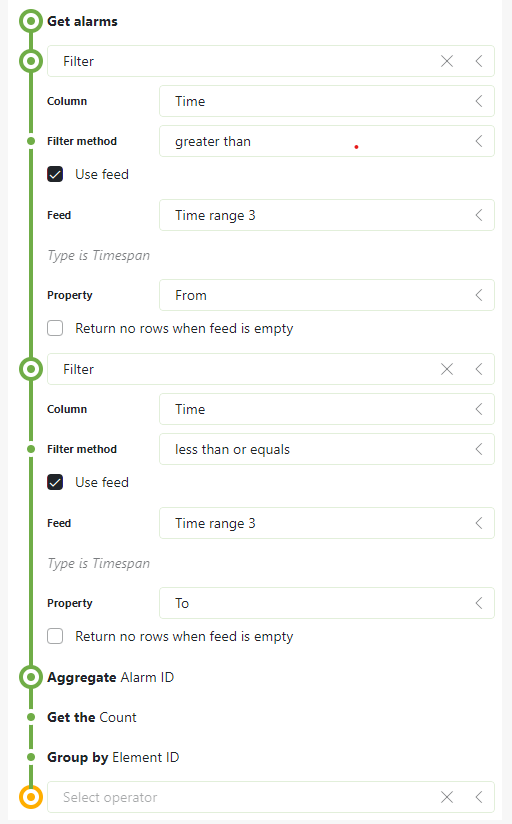
Displaying elements with the most alarms is already possible through GQI:

  1. Fetch the alarms, preferably within a certain time range (e.g. last week, you can link a time range component as a feed to your fillter)
  2. Count the alarms through an aggregation and group it by Element ID
  3. (Further improvement: you can join this element ID with the elements datasource to display a more readable name)
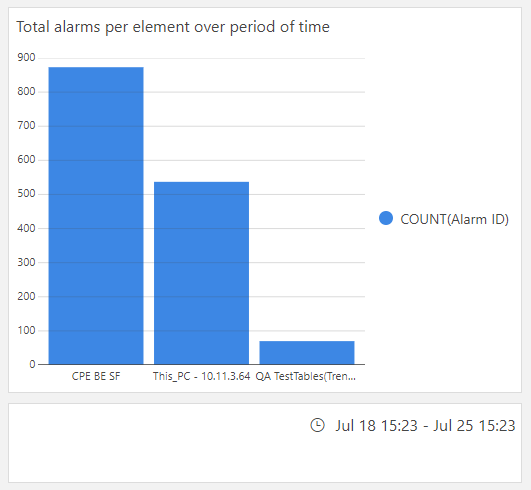
  4. This data can be displayed through a column and bar chart.

Alex Barnett [DevOps Member] Posted new comment 26th March 2024
Alex Barnett [DevOps Member] commented 26th March 2024

Hi, I see that this answer provides a solution for the total number of alarms over a time period; but what about the other part of this question? What’s the best way to generate an alarm distribution or scatter graph in the new Dashboards? Such that the alarm count can be plotted against a time axis to show the distribution (how alarms varied over time).

Please login to be able to comment or post an answer.

My DevOps rank

DevOps Members get more insights on their profile page.

My user earnings

0 Dojo credits

Spend your credits in our swag shop.

0 Reputation points

Boost your reputation, climb the leaderboard.

Promo banner DataMiner DevOps Professiona Program
DataMiner Integration Studio (DIS)
Empower Katas

Recent questions

Web Applications exception in Cube due to invalid certificate 0 Answers | 0 Votes
Redundancy Groups and Alarming – Duplicate Alarms 0 Answers | 0 Votes
Correlation Engine: “Test rule” doesn’t result in a hit, despite functional rule 1 Answer | 3 Votes

Question Tags

adl2099 (115) alarm (62) Alarm Console (82) alarms (100) alarm template (83) Automation (223) automation scipt (111) Automation script (167) backup (71) Cassandra (180) Connector (109) Correlation (69) Correlation rule (52) Cube (151) Dashboard (194) Dashboards (188) database (83) DataMiner Cube (57) DIS (81) DMS (71) DOM (140) driver (65) DVE (56) Elastic (83) Elasticsearch (115) elements (80) Failover (104) GQI (159) HTTP (76) IDP (74) LCA (152) low code app (166) low code apps (93) lowcodeapps (75) MySQL (53) protocol (203) QAction (83) security (88) SNMP (86) SRM (337) table (54) trending (87) upgrade (62) Visio (539) Visual Overview (345)
Privacy Policy • Terms & Conditions • Contact

© 2025 Skyline Communications. All rights reserved.

DOJO Q&A widget

Can't find what you need?

? Explore the Q&A DataMiner Docs

[ Placeholder content for popup link ] WordPress Download Manager - Best Download Management Plugin