Hi Dojo team,
We are planning to process traps from multiple Network Management Systems. Given the potentially high volume of traps generated by these platforms, we are reviewing the DataMiner Metrics. In particular, we came across the following benchmarks related to SNMP traps:
- Number of SNMP traps per second received on a DMA continuously: 100
- Number of SNMP traps per second received on a DMA in burst mode: 400
What is the difference between these two metrics? Specifically, how 'burst mode' is defined and what is the typical duration?
To ensure that the volume of processed traps remains within these limits, we plan to implement these metrics in the connectors (measuring the amount of traps per second that arrives to an element).
However, before to proceed with this update, is there a log file that we can use to determine the amount of traps received per DMA? If there is a log file that provides this information, I believe it will not be required to update the connector.
Thanks.
Hi,
The info about the number of traps per second is not being logged out.
The number of SNMP traps per second received on a DMA continuously is the constant average rate at which traps enter. If this is 100 then every second 100 traps can enter.
The number of SNMP traps per second received on a DMA in burst mode is the maximum that can enter in one second, after which the DMA needs some time to recover and process. This means that you still need to stay below the constant average rate. In other words if the constant average rate is 100/s and the burst is 400/s, then the DMA can take a hit of 400 traps but will need 4s to process this, so after receiving the 400 traps it needs 3s to recover at which no extra traps can enter. Actually these extra traps can enter but will be added to the queue, if they enter at a faster rate than can be processed then the queue will keep on growing (memory leak) and will take a long time before the result of the trap is seen (e.g. 30s after the trap entered you'll see the value in the element)
Do note that these numbers should be taken with a grain of salt as there are many external factors that could decrease the trap throughput number:
-CPU resources available: if there is something else taking up all CPU then there is almost nothing left for the SLSNMPManager and SLProtocol processes to do their thing
-DefaultReceiveWindow of the UDP buffer in Windows, which is by default 65kB. It can take 2ms before the SLSNMPManager process is notified that data is available in the buffer. Meaning is 70 traps enter with a size of 1kB within 1ms that the UDP buffer would be tried to be filled with 70kB, while the buffer size is 65kB, so Windows will have dropped 6 traps out of 70 before the SLSNMPManager could even start reading out the data. In this case you are indeed below the 100 traps per second, but the traps entered within 1ms, which is too fast. The solution in this case would be to adapt the Windows registry to increase the buffer size.
-Logging levels of the SLSNMPManager need to be set to No Logging. When the SLSNMPManager needs to log out everything, then this has a huge negative impact on the trap throughput
-SLProtocol logic: if the trap triggers a QAction that e.g. takes 5s to be executed then all other traps for that element are waiting to be executed as they are processed sequentially. Or there could be another QAction busy that processes other data that is being polled.
-Library that is used to process the traps and type of trap (SNMPv2 vs SNMPv3): WinSNMP is faster to process traps, but downside is that the receiving order is not guaranteed: e.g. when checking with Wireshark you could see traps enter in order 1,2,3,4 and in DataMiner the received order could be 3,1,2,4 (there is nothing we can do about that, WinSNMP is a "black box" of which we receive the traps in this order from). SNMP++ is slower to process traps, but the receiving order remains the same.
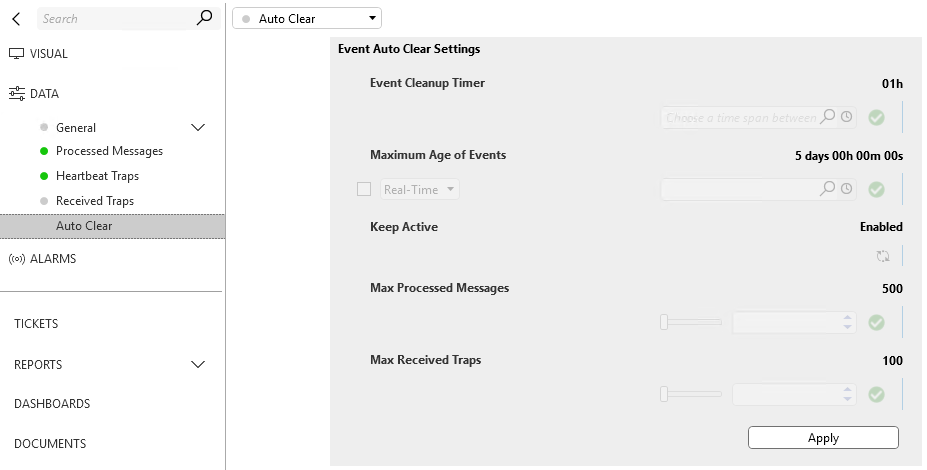
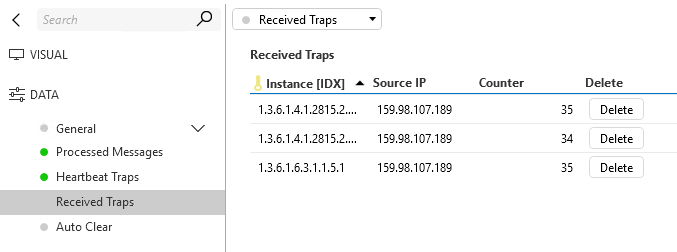
I realize this might not answer your question but can help you with testing and showcase the traps received with the Generic Trap Processor connector. It has counters for each source you define that represents where traps are coming from. Just check the config page and validate the retention is opened up as the defaults might impact your testing and be too restrictive. The connector and solution are both available in our catalog, solution shared below.
Smart Trap Processor | Catalog | dataminer.services
Hi Laurens,
Thanks for detailed explanation!