Hello,
We are facing momentary timeout events for few specific elements. So that I want to send statistical report to my operations.
I tend send the following in email from scheduler.

Can I trigger the above information in email?
Hi Jeyaram,
A first commonly used approach to have a better view on timeout statistics is using an ‘Alarm Distribution Graph’ in the Reports & Dashboards module. This can be filtered on timeout severity, and can be sent out as a mail also.
To create a Report Template for this
- Open ‘Reports & Dashboards’, navigate to Reports in the left-hand side menu and choose ‘Add new report’
- Enter name and description and choose an Alarm Distribution Graph as block to add.
- Update the Template Type to ‘Multiple elements/services’ as you will want to view statistics on multiple elements.
- Into the timespan, select the timespan which the report should cover.
- Into the included severities, choose ‘Timeout’ only.
- At this moment, you could generate this report already, select a view and see the results.
To send out by mail
- Open Scheduler > List and click the Add button to add a new task
- Complete general and schedule tabs. On the actions tab, choose email, check the ‘Include reports or dashboards’ and select the report that you just created to be sent out.
More information can be found on creating Report Templates on DataMiner Help , sending out reports by email on DataMiner Help
A second approach would be using an ‘Alarm List’ in the Reports & Dashboards module, and apply a filter to this which only applies to the elements you need. This can also be sent out as a mail, but will obviously only show timeout alarms for these specific elements.
A third approach could be also by using DataMiner Dashboard and creating a query which provides these results in a table. The dashboard could be shared in the cloud with other users, providing them access to it at any moment in time. That functionality is however not yet available into the version that you are running on your production environment.
In that case, I would recommend a Top 10 States/New Alarm Count graph. Although it is called Top 10, you can specify how many should be included. The result shows a graph and textual description on how many alarms occurred on a specific elements, ranked from high to low.
Let me know if that would not work out, or if you would be looking for something else still.
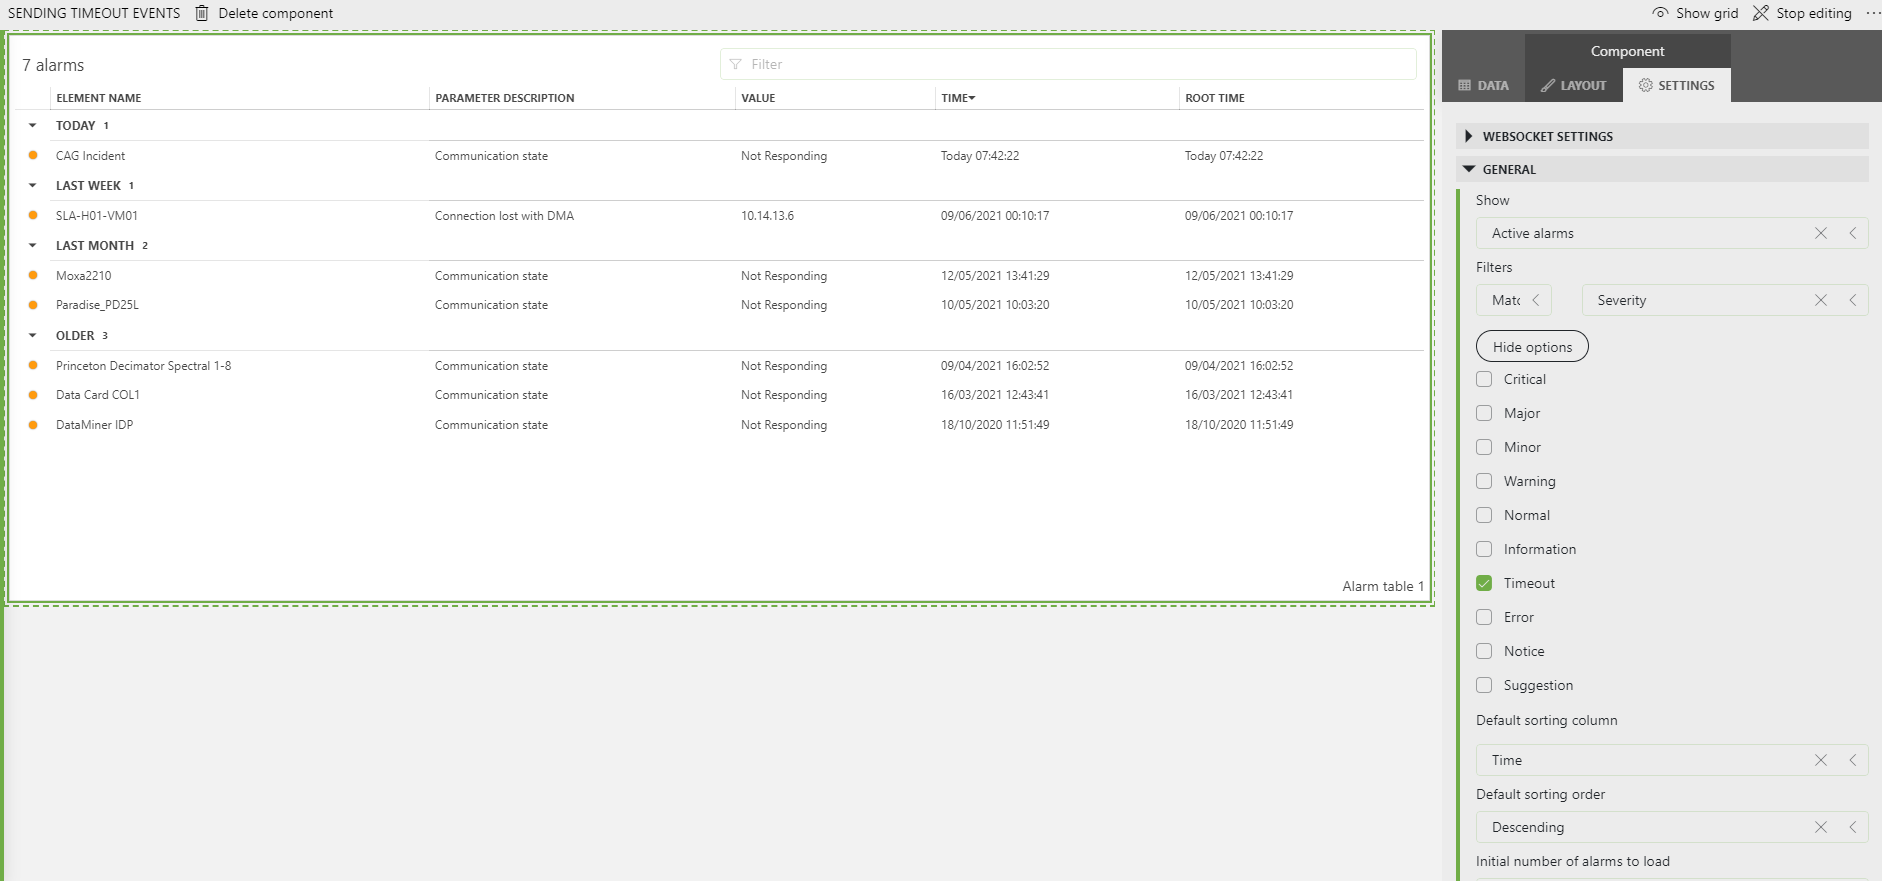
This use case could be achieved via the Dashboards Alarm component (see DataMiner Dashboards for more on this app), which could be set up to include only timeout events and further refined to any specific DataMiner entity such as views or elements.
You can then use the scheduler and automation engine to send the report to any operator (see sending reports by email).
Thank you,
Thanks Leander, I have already tried the ‘Alarm Distribution Graph’ but I don’t how many events for one specific element.
I want to see how many occurrence for one element in graphical representation.