Hi Dojo,
How are the average values for a trend calculated from the real-time values?
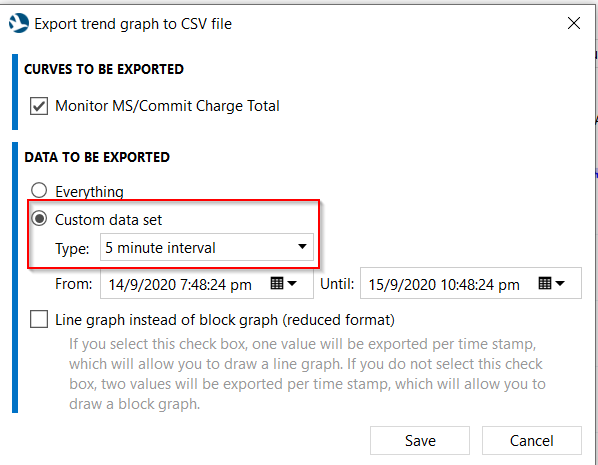
For example, I export the trend as CSV on a 5-minute interval (image below)
Similarly I obtain the real-time data.
If I compare the 5-minute interval CSV file's values with that of the real-time values, I am not able to establish a relationship on how the averages are calculated.
Please can you teach me how the 5-minute interval averages are calculated (preferably with an example), thanks in advance.
In short, every 5 minutes DataMiner will write an entry into the database, containing the average, minimum and maximum of the real-time trend entries (= all unique parameter values) generated over the previous 5-minute interval. When you request an export, these entries are retrieved from the database, processed and exported as a CSV file.
Some things to check and questions to ask that might help you:
- Using the SNetClientTest tool and/or by directly querying the database, you can check what the real-time and average trend entries look like, and if these would be different than the ones in the CSV export.
- It is possible to modify the default trend windows and set a custom interval, so that the 5-min-avg entry is actually calculated over a longer or shorter time span than you might assume
- Exception values are ignored by the average calculation, but I believe they are still exported in the real-time CSV file. If you manually calculate the average based on the real-time CSV export, you should exclude these as well.
In order to further assist, it would be useful to know what kind of anomaly you see. Do you get a small deviation from the expected average values, or do you get a complete mismatch?