Dear community,
we need to setup a mail alert, which is collecting during 5min the alarms of a service (only critical alerts). When this alarm is returning back to normal, this should also been shown in the report (with the critical alarm as well).
The first part is easy, but if I add the normal state too, the report is not showing up the critical alert anymore in the email, only the normal state, with the root time of the critical alarm.
We need a line per critical alert with his root time, and the return of normal (if any) with the time when it turned back to normal, or the durtion of the critical state when it returned to normal.
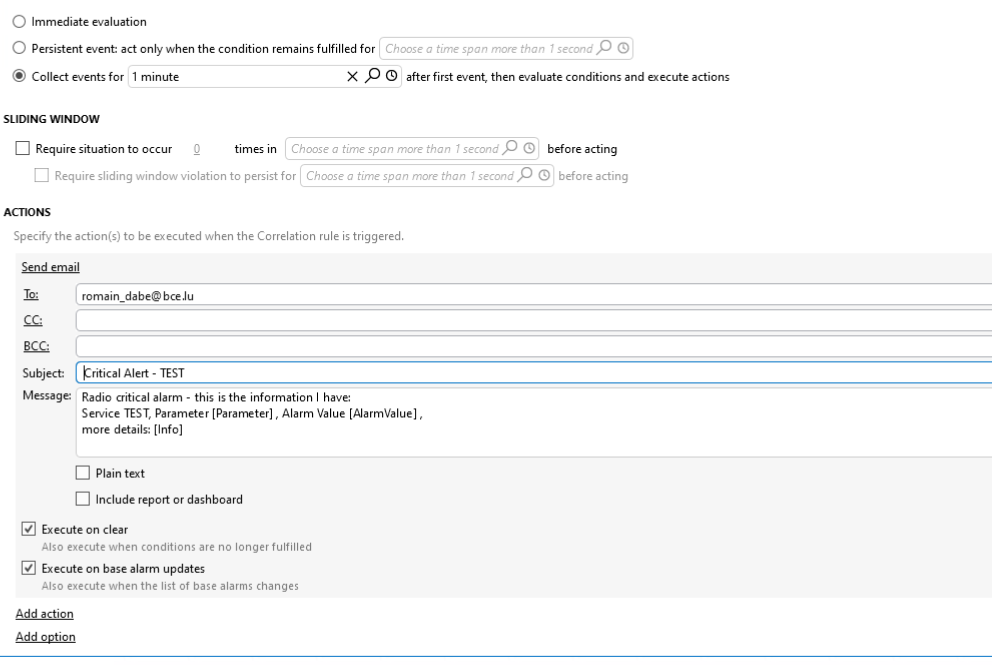
Here the current correlation rule:


Many thanks for any advice.
Romain
In the send email action, you have the option to include a dashboard. With Dashboards, you have a lot more options of what data you want to show. You could create a dashboard with an alarm table component, make it show the root time, and apply the filters to make it only show critical alarms of this particular service. If you want even more flexibility, then you can create a GQI query on the get alarms data source, which you could join on the root alarm ID to include the time when an alarm went back to normal. There's a GQI custom operator available to calculate a duration (GitHub).