Hi Dojo,
I've started to use this Alarm Report dashboard in staging, however I'm getting a different colour palette for the severities displayed in the dashboard: any idea where this is taken from and how I can revert to standard colours?
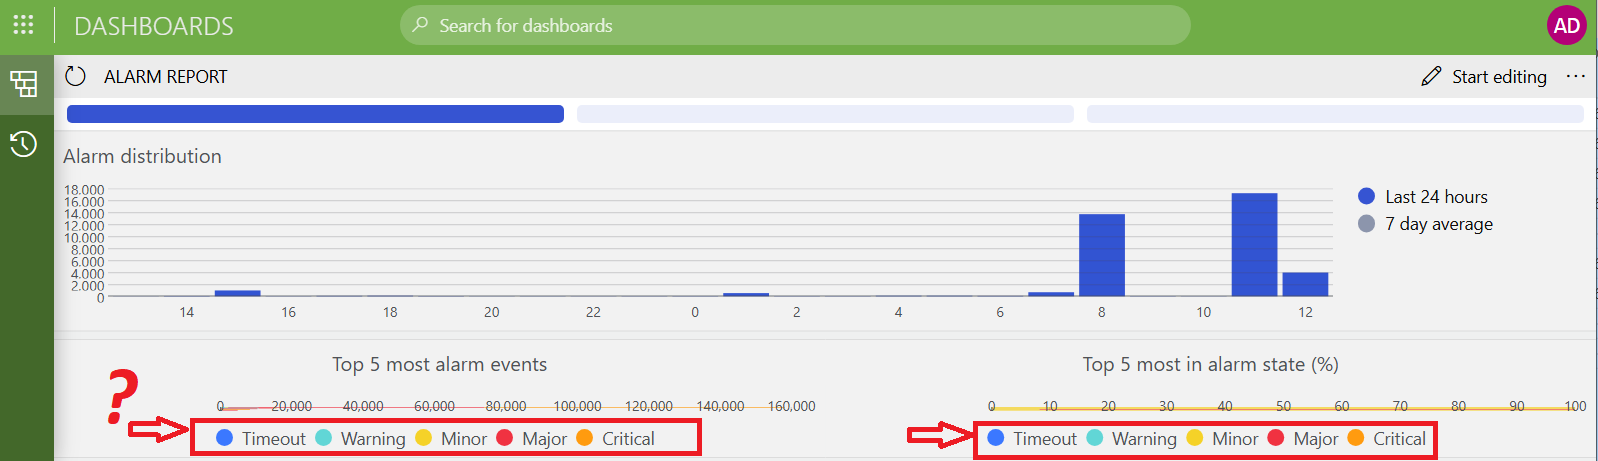
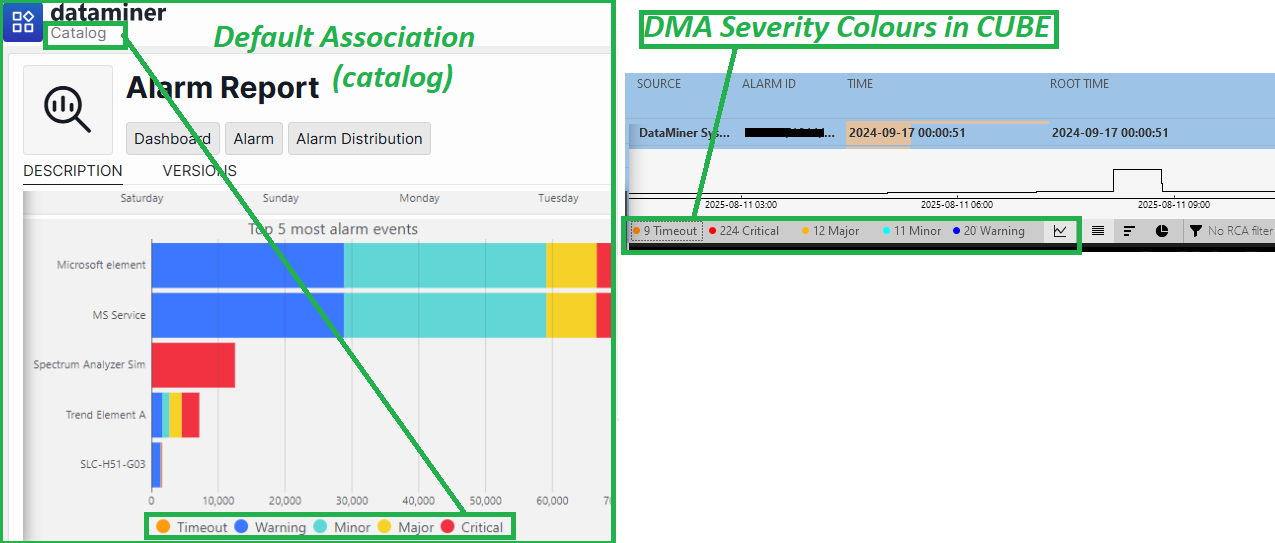
The example from the catalog (1.0.1-CU4) and the severity in the staging system where this is deployed seems to match the default palette (= e.g. TimeOut is in Amber and so on...)
Thanks
Hi Alberto,
I have taken a look at the package and found that the alarm colors are defined in the component themes. These can be found in Layout -> Styles -> Color -> Data colors. By default the configured colors are assigned in the order that they are defined. This means that the first data that needs a color takes the first color, the second the next, and so on. Have you done any edits to the dashboard/queries that make the data sources return data in a different order?
Update: added a screenshot of the colors & bars config.
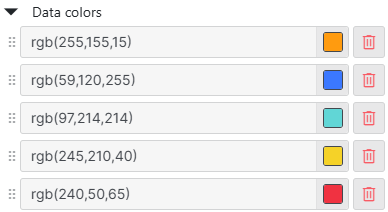
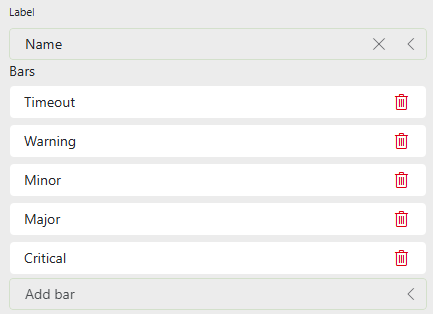
I have added a screenshot of the configs
Got it! Found it now! Thanks for the prompt support – marking as solved
Thanks Wout – no change, no – this is how it shows after a first deployment in pre-prod – could you please share a screenshot in the answer? Will try to re-tune asap