Skip to content
DataMiner DoJo

More results...

Generic selectors
Exact matches only
Search in title
Search in content
Post Type Selectors
Search in posts
Search in pages
Search in posts
Search in pages
Log in
Menu
  • Updates & Insights
  • Questions
  • Learning
    • E-learning Courses
    • Empower Replay: Limited Edition
    • Tutorials
    • Open Classroom Training
    • Kanban workshop
    • Certification
      • DataMiner Fundamentals
      • DataMiner Configurator
      • DataMiner Automation
      • Scripts & Connectors Developer: HTTP Basics
      • Scripts & Connectors Developer: SNMP Basics
      • Visual Overview – Level 1
      • Verify a certificate
    • Video Library
    • Books We Like
    • >> Go to DataMiner Docs
  • Expert Center
    • Solutions & Use Cases
      • Solutions
      • Use Case Library
    • Markets & Industries
      • Media production
      • Government & defense
      • Content distribution
      • Service providers
      • Partners
      • OSS/BSS
    • Agile
      • Agile Webspace
      • Everything Agile
        • The Agile Manifesto
        • Best Practices
        • Retro Recipes
      • Methodologies
        • The Scrum Framework
        • Kanban
        • Extreme Programming
      • Roles
        • The Product Owner
        • The Agile Coach
        • The Quality & UX Coach (QX)
    • DataMiner DevOps Professional Program
      • About the DevOps Program
      • DataMiner DevOps Support
  • Downloads
  • More
    • DataMiner Releases & Updates
    • Feature Suggestions
    • Climb the leaderboard!
    • Swag Shop
    • Contact
    • Global Feedback Survey
  • Support
  • PARTNERS
    • All Partners
    • Technology Partners
    • Strategic Partner Program
    • Deal Registration
  • >> Go to dataminer.services

Alarming Media Proxy Logserver

Solved825 views18th July 2023Mediaproxy
0
Mark Woodyatt [DevOps Advocate]438 25th June 2021 1 Comment

Hello All,

We are having trouble alarming a Media Proxy Logserver.

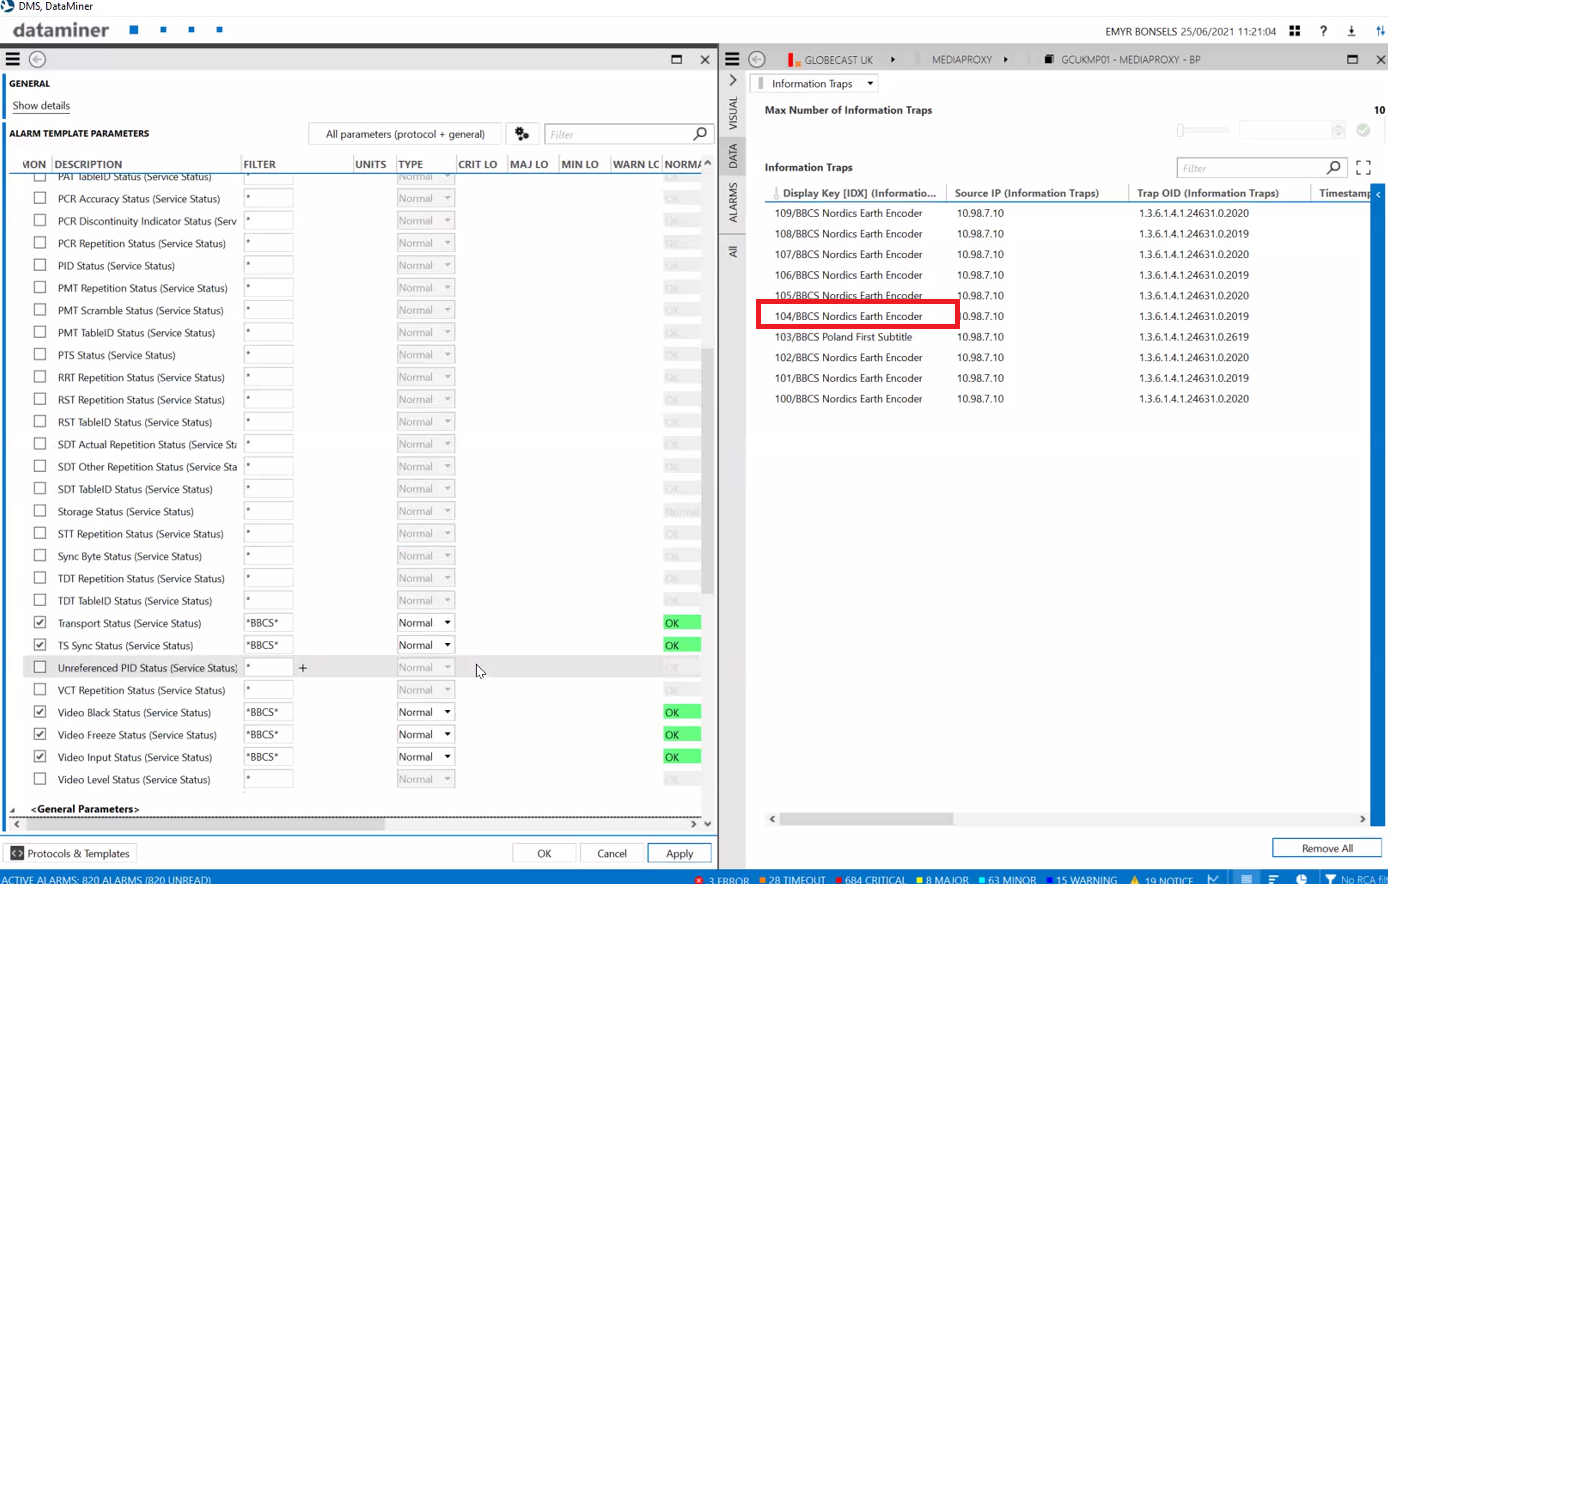
The attached screengrab shows, on the left, an alarm template. But although the parameters have been enabled on the alarm template the element is still gray. Is this because the MediaPRoxy Logserver only works on traps & a trap needs to come in for the alarm to be triggered?

On the right of the screengrab, are traps that are being received on the status of an encoder. How do we alarm for these traps, please?

Rgds,

Mark

Marieke Goethals [SLC] [DevOps Catalyst] Selected answer as best 18th July 2023
Mark Woodyatt [DevOps Advocate] commented 20th July 2021

Hello Laurens,
How do I monitor a service, please?
Should services appear in the Service Status table?
Rgds,
Mark

1 Answer

  • Active
  • Voted
  • Newest
  • Oldest
2
Laurens Moutton [SLC] [DevOps Enabler]8.89K Posted 28th June 2021 2 Comments

Hi,

Based on the configured alarm template I see that rows are monitored from the “Service Status” table that only contain “BBCS” in the display key.

The displayed table in the screenshot is the “Information Traps” table, which is probably not monitored.

If there are no rows present in the “Service Status” table that contain “BBCS” then it means that the other rows in that table are not monitored and have no severity (also not “Normal”, green status color). If there are also no other parameters with a severity then there is no severity to be reflected on the element itself, resulting in a grayed out element.

To be able to see the “Normal”, green color, reflected on the element, there needs to be a monitored row present with severity normal. That means in this case if there was no trap received yet, or cleared traps are automatically removed, that there is no “Normal” severity to reflect on the element.

Marieke Goethals [SLC] [DevOps Catalyst] Selected answer as best 18th July 2023
Mark Woodyatt [DevOps Advocate] commented 21st July 2021

Hello Laurens,
How do I monitor a service, please?
Should services appear in the Service Status table?
Rgds,
Mark

Laurens Moutton [SLC] [DevOps Enabler] commented 22nd July 2021

Hi,
I’m not familiar with that driver, but based on the screenshot of the alarm template it seems that you’re trying to monitor something from the “Service Status” table. The content of that “Service Status” table is not displayed in the screenshot. The driver help could give more information of how that table gets filled in or you could also contact your Skyline Technical Account Manager to perhaps show a small demo to them.

Please login to be able to comment or post an answer.

My DevOps rank

DevOps Members get more insights on their profile page.

My user earnings

0 Dojo credits

Spend your credits in our swag shop.

0 Reputation points

Boost your reputation, climb the leaderboard.

Promo banner DataMiner DevOps Professiona Program
DataMiner Integration Studio (DIS)
Empower Katas
Privacy Policy • Terms & Conditions • Contact

© 2025 Skyline Communications. All rights reserved.

DOJO Q&A widget

Can't find what you need?

? Explore the Q&A DataMiner Docs