Hi Dojo,
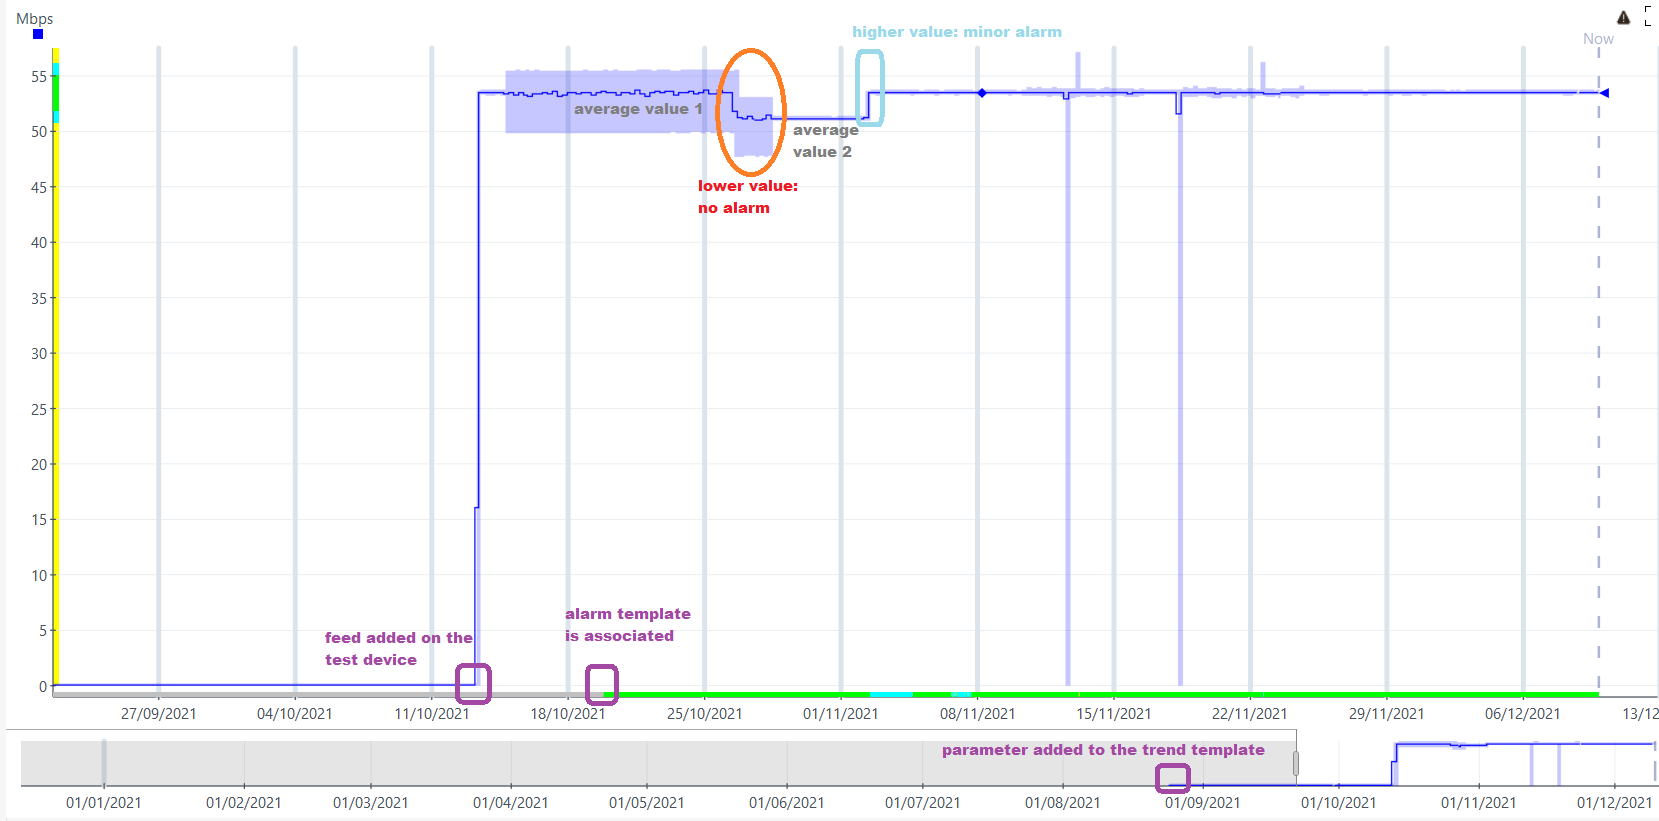
I've been running a test with the smart baseline config, same option as shown in this post to detect continuos degradation (over 7 days): for some reason, though, even if the Delta was exceeded at a given time (simulated a drop to 0 for the bitrate), the root time of the alarm did not coincide with the bitrate drop to zero - it was some hours later: this is shown in the trends, as the minor violation (light blue) kicks in after - when our test feed dropped to zero we didn't have an alarm (the axis has still the green colour):
Wondering if this can be related to the "auto" option or if there is something else that I'm missing:
When leaving the "Auto" option checked, what root time is expected for the alarm?
Thomas, this is the trend data retrieved:
This the alarm template for the parameter:

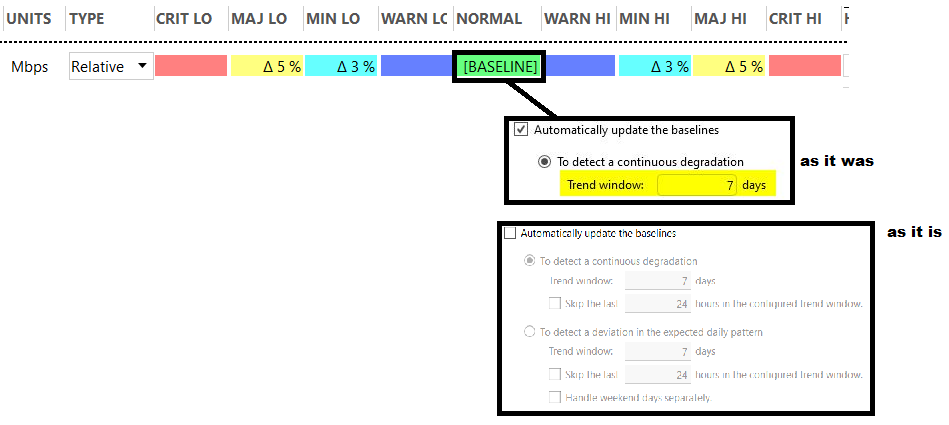
I've added my interpretation below - I think the lower Delta was originally missing or at a different value - would this explain the observed behaviour?

Now, when automatically updating the baseline over a period of 7 days, when would the updated baseline kick in? Is it calculated over a 7 days sliding window?
Thanks
Hi Thomas, all clear now – just one last detail, please:
When a DMS is (re-)calculating the baseline every 24h basing on the previous 7 days, is it done daily – at a given time (perhaps configurable?), or is it done at 24h from the moment the baseline was added?
In general, at which time shall I expect to see the first “Re-Calculating baseline” line in the logs? Is it going to be only after the first 7 days?
Assuming this is done by the DMA that hosts the element – correct?
So would it resume automatically if the DMA is down for maintenance or is the baseline re-calculation just skipped if at the chosen time the DMA is not running?
Hi Alberto,
There is no exact moment in the day that these calculations are done, it depends on when the template was first created or the last calculation was executed. The DMA will regularly check whether a recalculation is needed by simply looking at the last calculation time. If this exceeds 24h, the recalculation is executed.
The DMA will regularly retry the baseline calculation for a new parameter that does not have enough trend data available. I believe this happens quite often to ensure a baseline is calculated ASAP. The first baseline value will not take 7 days but only a few days or even less. (We are not 100% sure what the expected sample amount is yet, but will update this soon once we did some extra digging)
These calculations are indeed done on the hosting DMA. When an agent starts up, the calculation will always be executed (or at least tried depending on the available trend data).
Hi Thomas, indeed in this test set-up I’m relying on the option “use current value as baseline” so you’re correct, my baseline will be there instantly. What I’m trying to establish is when the first update to that baseline value will be performed, so that we know after how long we can look for that line in the logs.
Hi Alberto, Thanks for all the clear screenshots.
“I think the lower Delta was originally missing or at a different value – would this explain the observed behavior?”
-> Yes. We later noticed your other question that made us already suspicious that a lower delta was missing/incorrect. That could indeed explain the behavior seen in your original question.
In regards to the new trend graph/question. The baseline is (re-)calculated every 24h using the trend data of the 7 days prior to that point in time. You should be able to see this happening when you increase the loglevel of the SLSmartBaselineManager.txt logfile to 5 (Debug). A line will be logged with a message like ‘Calculating baseline for parameter X on Y’ where Y is the element ID. I would expect a line like that to be logged every 24h for each element where the calculation is enabled.
I suspect that no alarm was created during the initial value drop because it was just within the normal boundaries. It is unfortunately guessing work to what the baseline value was by just looking at the graph. The lighter blue areas also show that the blue line was averaged a bit, so the actual values could be different.
I hope the above explanation cleared things up for you. If not, definitely feel free to let me know!