Hello Dojo Community,
I'm looking for some assistance regarding alarm filtering within DataMiner.
Current Setup & Target:-
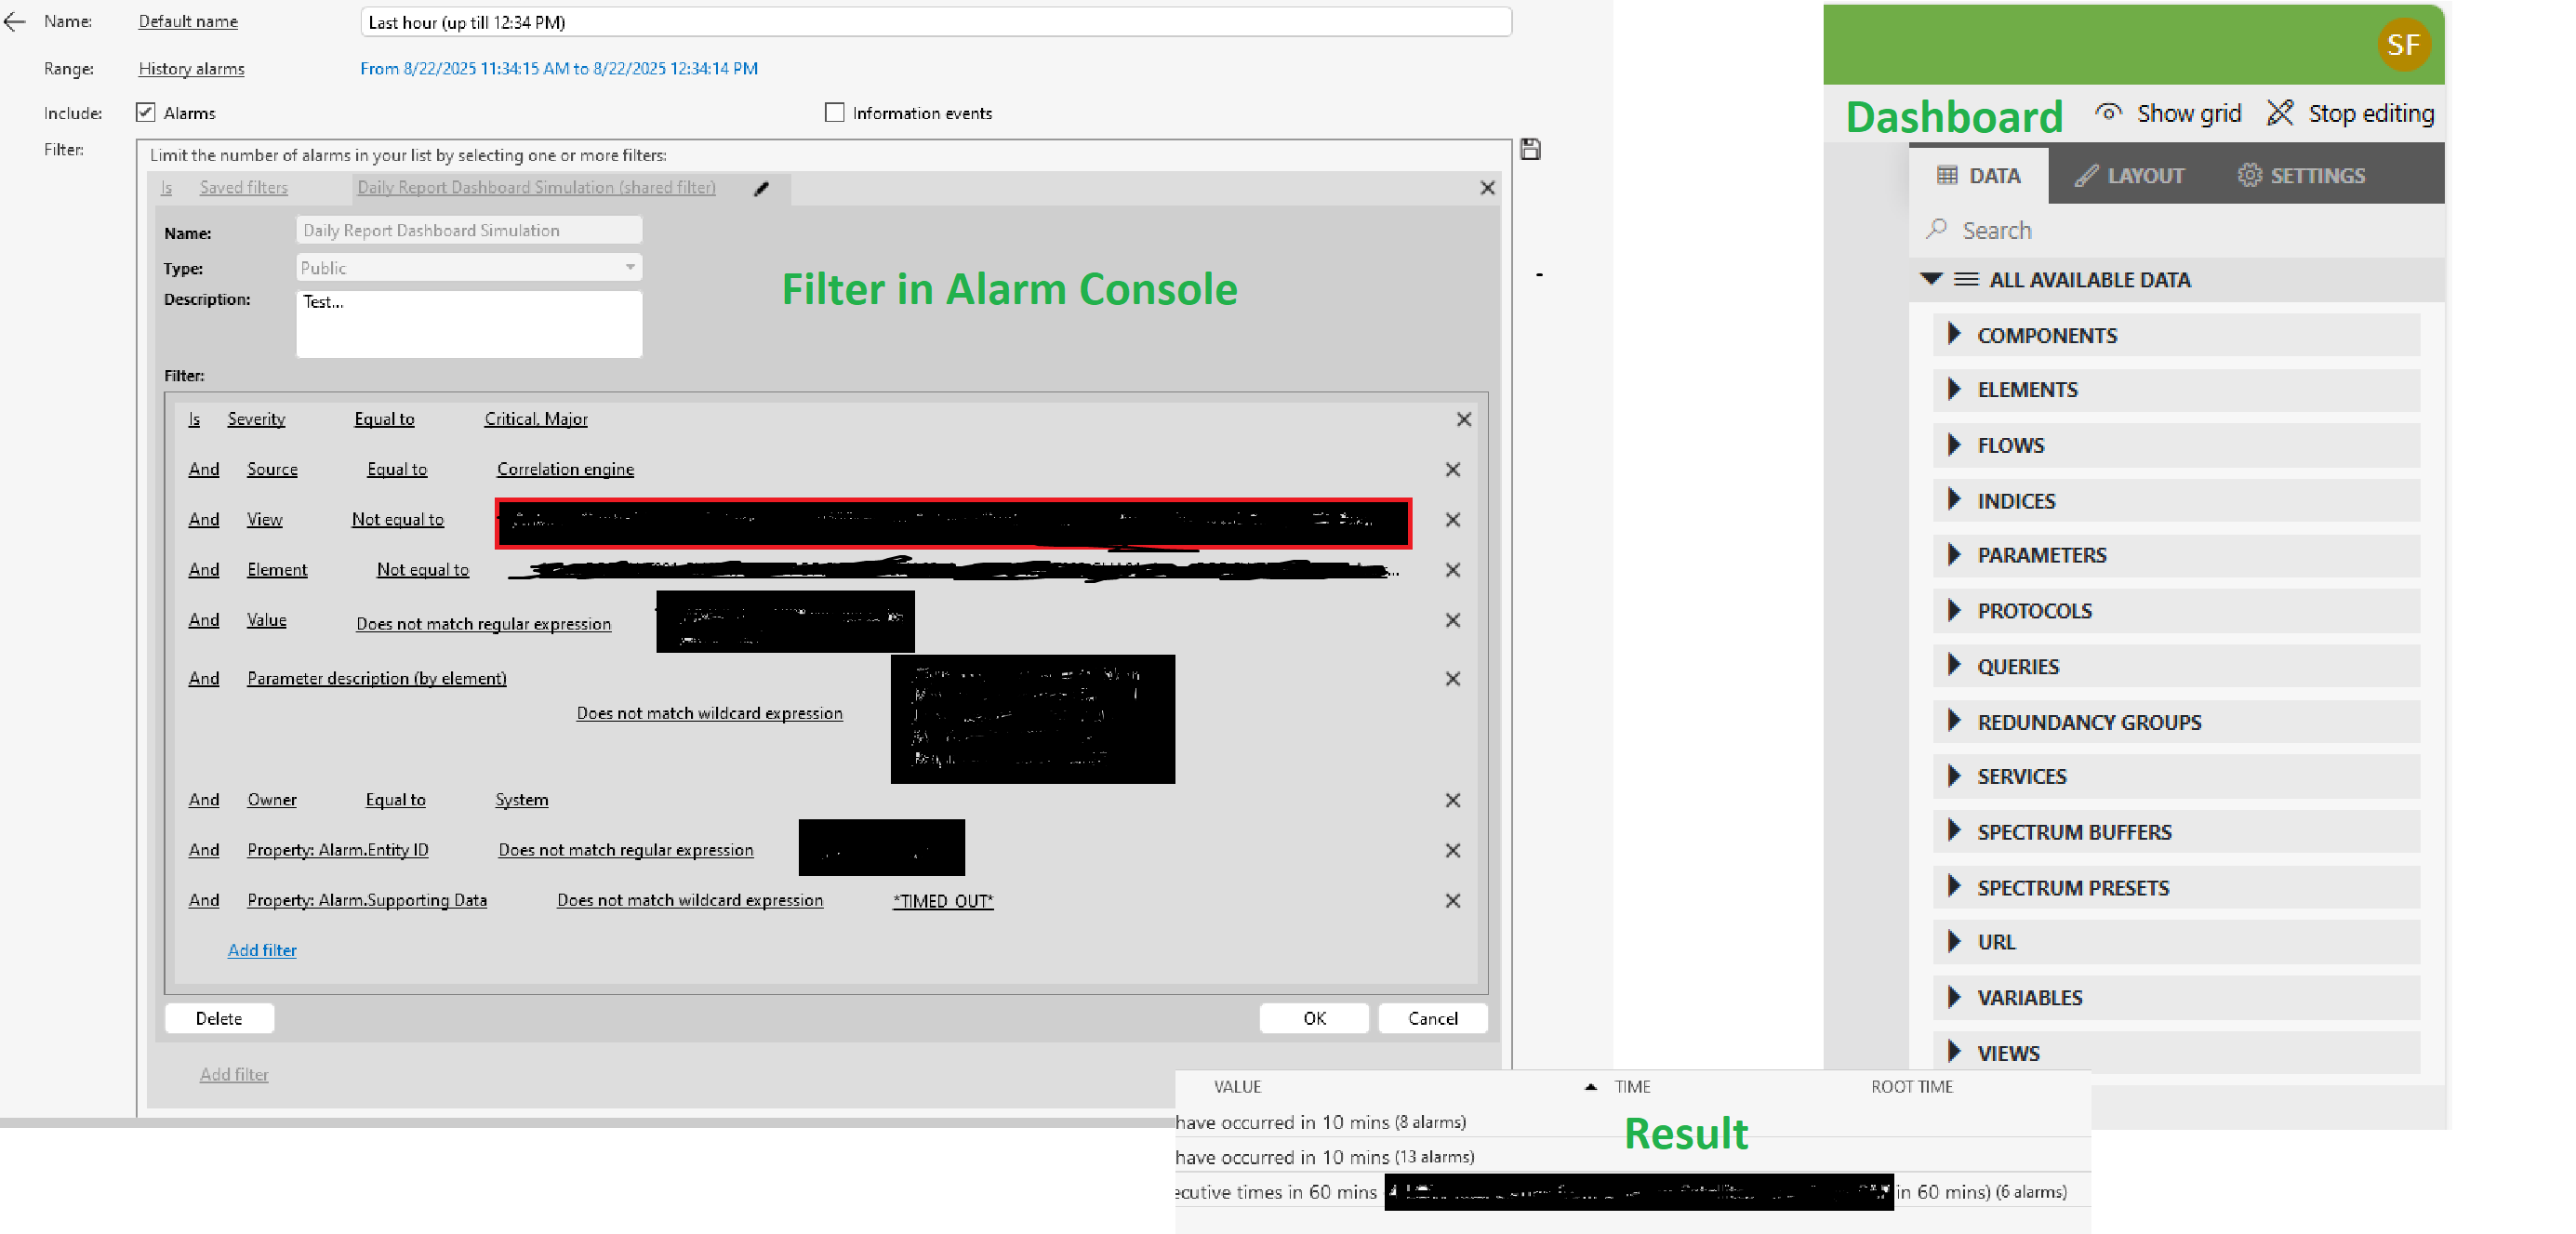
I've successfully configured an alarm filter directly in the DataMiner Alarm Console. This filter is proving incredibly useful for live operational monitoring. I will like to integrate this existing, refined filter into my DataMiner Dashboards and Reports modules to fully automate the analysis and presentation of alarm data.

Drifting from the manual approach to this sort of automation will afford operations:
- Real-time Visibility: Dashboards will offer immediate, up-to-date insights into filtered alarms without manual intervention.
- Enhanced Operational Efficiency: Eliminating the need to manually apply the filter saves time for operators
- Improved Decision-Making: Consistent and automated reporting provides clearer data for faster, more informed decisions.
- Historical Trending: Easy tracking of trends over time, which is crucial for proactive maintenance and identifying recurring issues.
- Reduced Alarm Fatigue: By consistently applying the filter, operators see only the most relevant alarms, reducing overwhelming noise.
My Request:-
Could anyone offer some guidance or best practices on how to:
- Import an existing Alarm Console filter directly into a DataMiner Dashboard? I've set up a dashboard and want to ensure the widgets (e.g., alarm lists, charts) reflect the same filtering logic I'm using in the console.
- Apply this same filter logic when generating DataMiner Reports? I want my scheduled reports to also leverage this precise filtering.
Any steer, examples, or pointers to relevant documentation would be greatly appreciated!
Thanks in advance for your help!
Best regards,
Samson
Hi Samson,
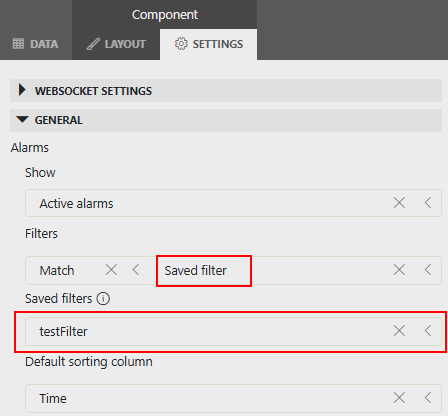
Saved filters can be used with the alarm table component:

Another option is using the ad-hoc data source SLC-GQIDS-ActiveAlarmsUsingFilter. This ad-hoc data source allows you to use saved filters:

Hope it helps.
Hi Samson,
I see that your dashboard doesn't have any component. Can you try first adding the alarm table component to your dashboard?
Once the alarm table component is available in your dashboard, click on the component to select it, and go to Component -> Settings. The 'Settings' page will display the settings of the selected component.
The presentation of my settings doesn't have this option/General tab