A single incident in your operation will very typically cause multiple alarms across your operational systems. For instance, a power outage can cause timeout alarms on a whole rack of devices, or a failing satellite connection can cause troubles further down the line. This can make it a challenge to figure out what exactly has happened, especially if multiple issues arose at the same time. The upcoming Automatic Incident Tracking feature, which is part of our DataMiner Augmented Operation fully integrated AI capabilities, can lend you a helping hand. It can also save you a massive amount of time, both in terms of responding to incidents as well as in terms of having to set up and configure your DataMiner System.
The new Automatic Incident Tracking feature will try to group alarms in the Alarm Console that belong to the same incident, thus providing a better overview of the current issues in the system. You may think this sounds easy. However, the key differentiator here is that unlike traditional alarm correlation, which requires manual configuration and maintenance over time, this is done completely autonomously by the DataMiner System, based on what it has learned from past alarm activity in your specific system and considering a broad range of auxiliary data that can provide further clues as to what the most likely root cause of an incident is.
We are continuously aiming to make your DataMiner System more and more intelligent, so we will keep expanding the auxiliary data that is considered. At the moment, this includes the following data:
- The service the alarm belongs to (defined based on services you created or based on services generated by your SRM Solution if you also use DataMiner for orchestration).
- The IDP location of the element the alarm was generated on (defined by our IDP Solution, which provides structured metadata about where managed elements are located, such as which building, which rack, etc.).
- The element the alarm was generated on (as two alarms on a single element are more likely to be related than two alarms on two different elements).
- The parameter (and protocol) that the alarm was generated on,
- The polling IP of the element the alarm was generated on (only for timeout alarms though, as this capability will also attempt to isolate the root cause of multiple timeout events entering your system).
All the above information provides clues as to what the potential root cause can be, i.e. which alarms potentially belong together and are likely to be caused by the same incident. But this technology takes more into account than only that. Two important considerations are for example time, and past behavior of alarms in the system.
Time, because the closer in time different alarms enter the system, the more likely they are to be effectively related to one another. And when it comes to past behavior, this capability essentially watches all alarms occurring in your system around the clock and derives knowledge about each of them. Knowledge about how frequently they happen, or for example how likely or unlikely they are to happen at a specific time of the day. And also this knowledge is added into the mix to make the incident assessment that we are talking about here.
This new capability will process that wealth of data in real time around the clock, and will make an intelligent assessment to determine what the most likely root cause is. In other words, it applies the kind of reasoning that many operators would probably also apply, with the difference that it can do it much faster, while really considering a massive amount of information in the blink of an eye.
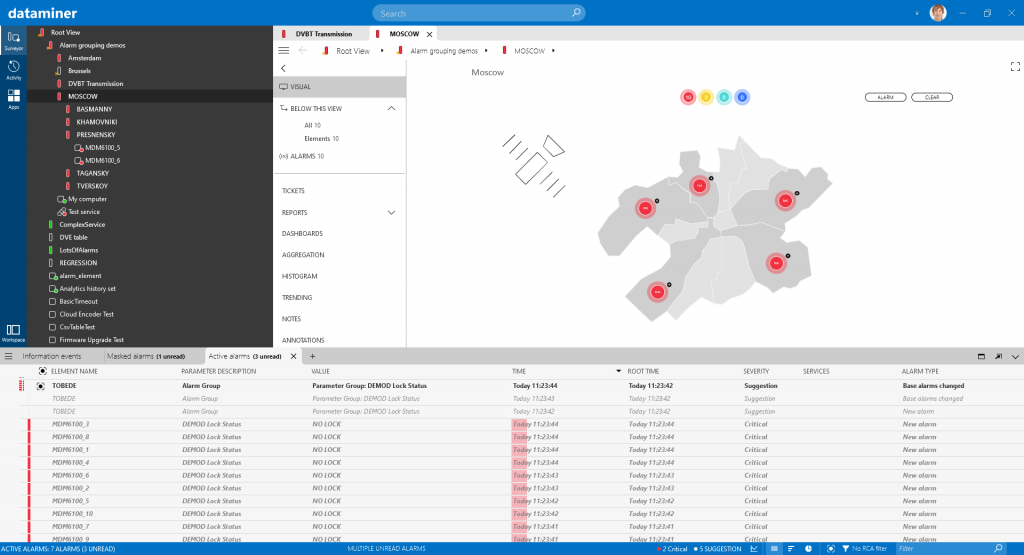
For instance, below you can see a failure on a satellite link, causing alarms on the parameter “DEMOD Lock Status” of multiple distributed receivers of the same type (and note that there is no configuration in this system that defines a relationship between those receivers and the failed satellite link).
Based on an evaluation of all data, along with knowledge about past behavior, this feature will fully automatically group all those DEMOD Lock Status alarms into a single incident in the Alarm Console. It will also indicate that the main “common denominator”, or the main motivation for creating that bundled incident, is the fact that all metrics are DEMOD Lock Status – although of course other information was considered and used to reach that conclusion.

This example may seem very simple and logical to you, because it obviously is very logical for anybody looking at it. But that is in fact the exact objective of this capability, to do the things that we all consider to be very logical. The key difference, of course, is that a human operator would take quite some time to reach this logical conclusion, while this capability does it automatically, continuously around the clock and at run-time as events are unfolding in the live operation, and, importantly, without the need for you to configure it.
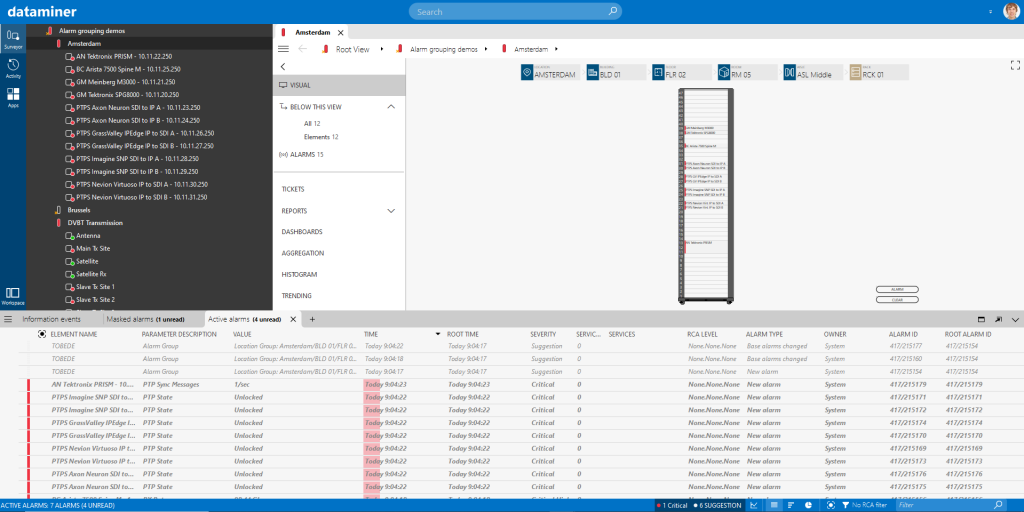
In the example below, the value of the alarm group “Location Group: Amsterdam/BLD 01/FLR 02/RM05/ASL Middle/RCK 01” tells you all alarms in the group are on a device in a single rack. Again, it is one of the principal motivators for DataMiner to make that grouping decision, but of course in the background all other relevant data is also considered and weighing in.

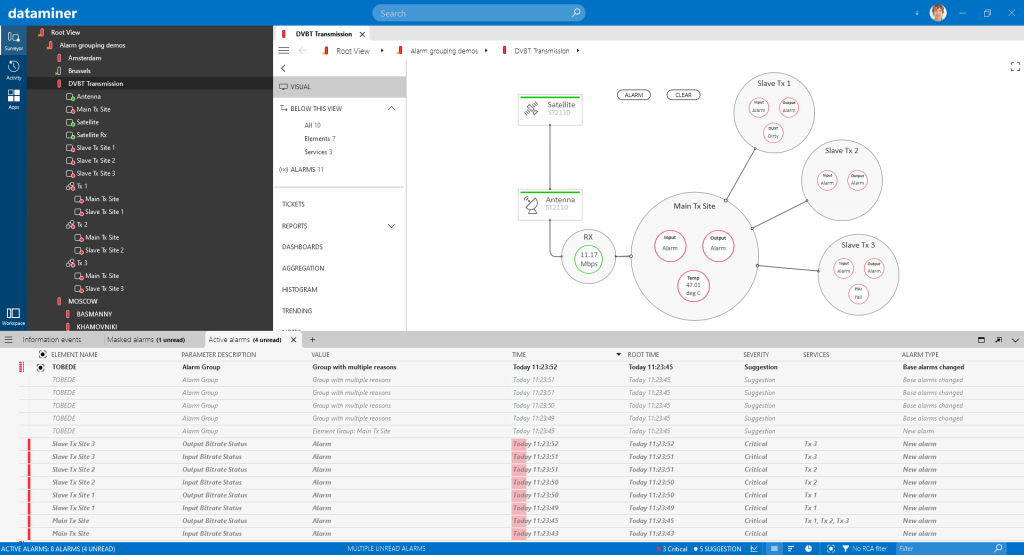
If there is no obvious reason for grouping the alarms, the group will get the value “Group with multiple reasons”. In the example below, for instance, a connection problem at “Main Tx Site” caused a problem at three other sites. Two alarms at the main site are linked because they belong to the same element. The alarms at the three slave sites, however, are linked to the alarms on the main site because they belong to the same service. So different alarms are bundled in the same incident for different reasons. In fact, other alarms that at first sight probably would be considered part of the incident have actually been omitted from the incident based on knowledge about their historical behavior.
A conclusion that a human operator very likely would have come to as well, with the main difference being that DataMiner did this in a split second as events unfolded, and it would have taken the operator considerable time and effort to do the same. If you now also consider a realistic situation where multiple unrelated incidents are occurring at the same time, you can no doubt see the power of this technology.
