Hi Dojo,
I’m trying to show a table column in a dashboard using the “State” view but it seems that only shows the first 100 column indexes. Same with progress bar or gauge view.
Is there any way to change this limitation?
Thanks in advance!
The amount of parameter rows is indeed limited to 100 when there is no filter specified. This is a hard limitation in the software to avoid overloading the system.
When you want to see more or other indices, I would suggest to include a Parameter feed to the dashboard and link it to your state component. Then you have full control over what rows you want to visualize, and there the limit does not apply.

Hi Manuel,
Indeed, the state visualization limits its content to max 100 entries when the data is unfiltered. There is currently no way to change this limitation.
Depending on your use-case the following solution might help:
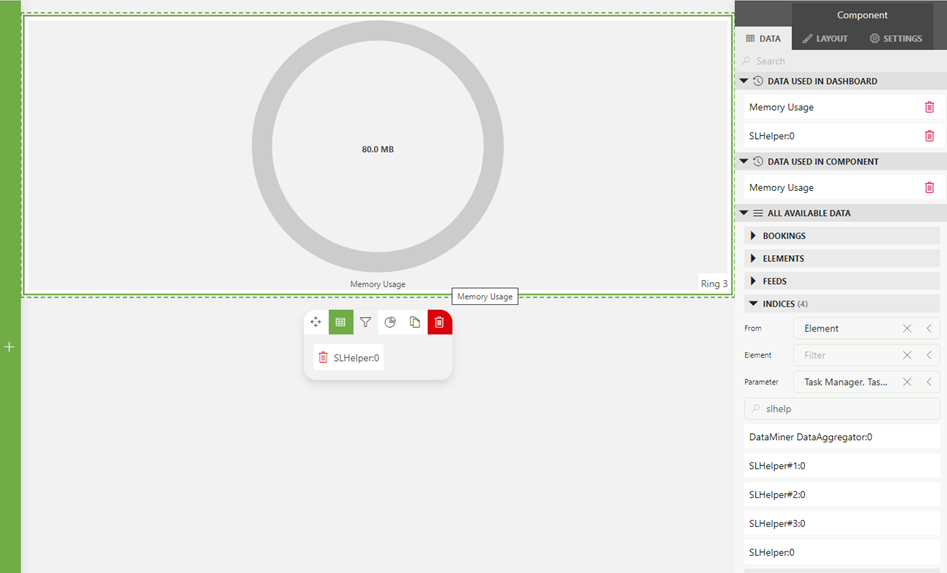
You could filter your state/gauge/progress bar component with the indices you are interested in by applying an index as a filter: