Hi Friends,
Is it possible to get use of queries to get indexes in order to use them for filtering data on trending, charts or tables on the dashboards app?
If so, how do you do that since when we select the filter options the only indexes that are available are the ones of the parameters or elements selected?
Thanks in advance;
Regards
Hi Euler,
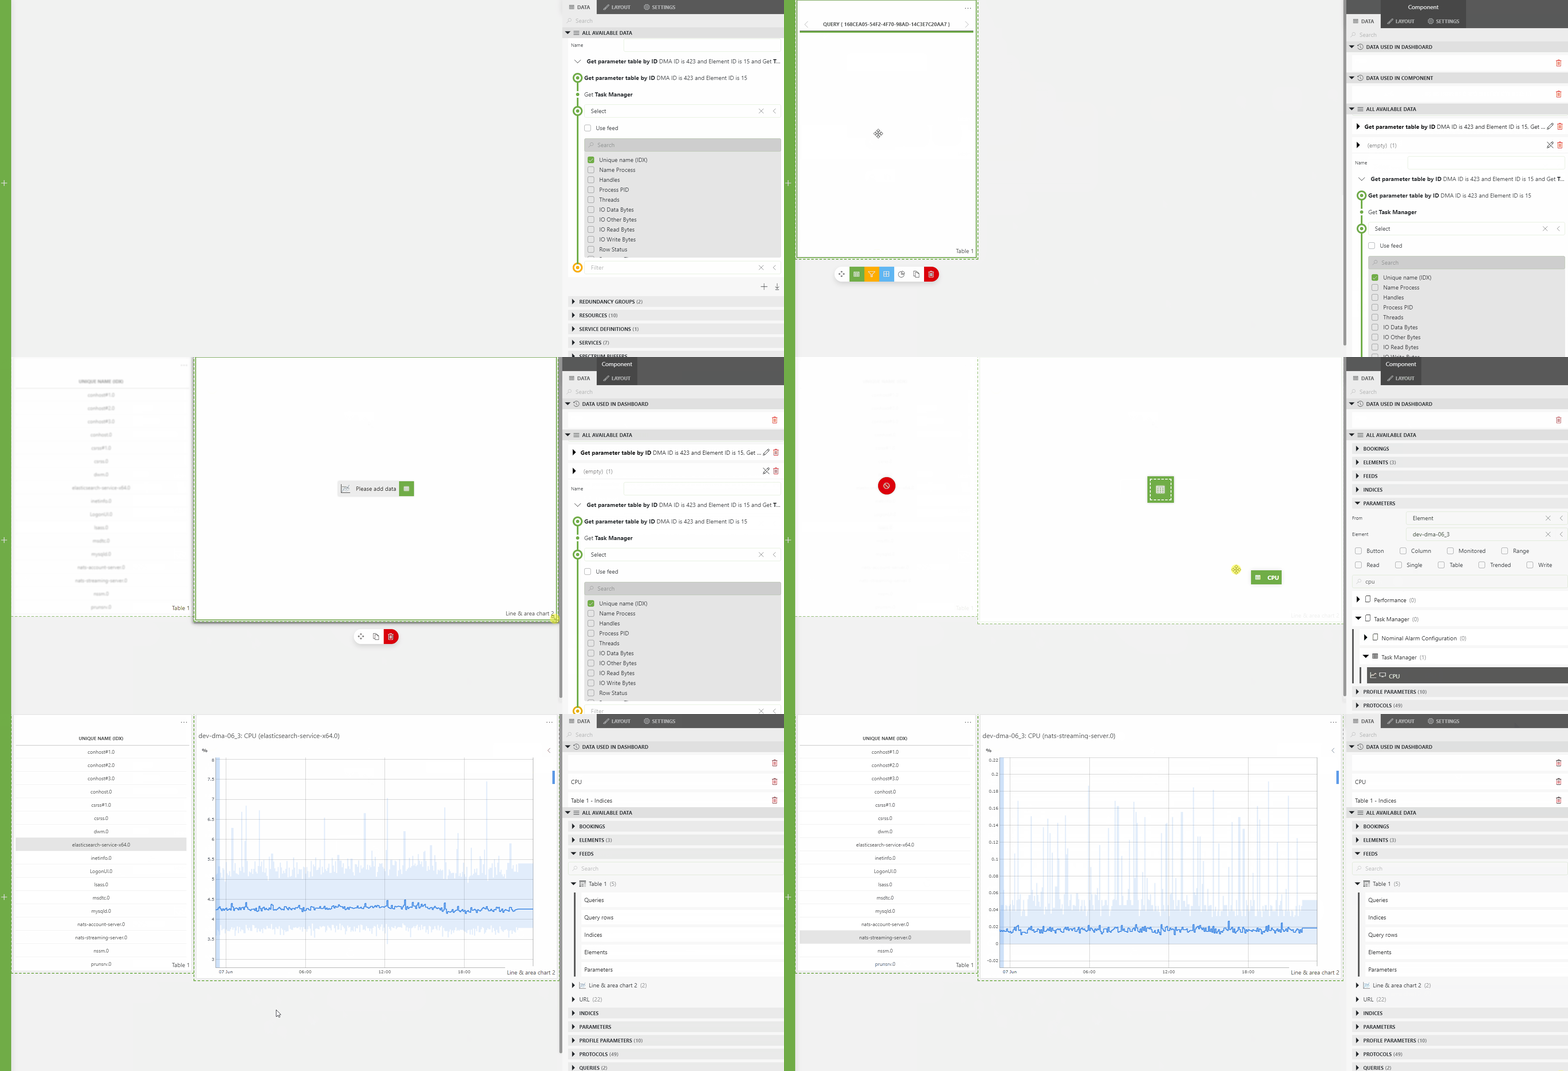
The resulting rows from ‘a query that selects rows from a table’ can be used as an index feed for another component. Selecting a row in the table will send out the corresponding index in the feed. This feed can then be consumed by the line chart in order to display a trend graph.
I’ve created a small demo of this:

I hope this somewhat answers your question. Please let us know if you have any additional questions.
My pleasure! When creating this setup for indices from multiple elements, be sure to use a ‘Get parameters for elements where protocol equals …’ data source. Also note that you’ll need to drag a protocol parameter on the line chart instead of an element parameter. As a last step, you’ll also need to feed the element selection from the table to the line chart.
Thank you again Sebastiaan,
That small demo was very useful.
I´ll try that and see how that behaves with several elements with multiple indexes.
have a good day