Hi There you all, Hope everybody is fine.
we´re trying to set up a query on the dashboards to retrieve the utilization of some interfaces in several switches as well as the cpu and memory and concatenate it on a dashboard to see the top 10 interfaces and cpus utilization over a 7 day time frame.
So far, we managed to get the query to bring all the real time data that we want, but we could not yet get the avg, max and mininun for those parameters and also could not get that on a trend statistics.
My question is: Is there a way to get the query result as a feed to use on a trend table or graphic?
I would be very grateful if anyone can also share some insights on that.
Best regards to you all.
Hi Euler,
Retrieving trend records has been introduced in 10.1.4, although it’s currently still behind the ‘Generic Interface’ soft launch option. More information about soft launch options can be found here.
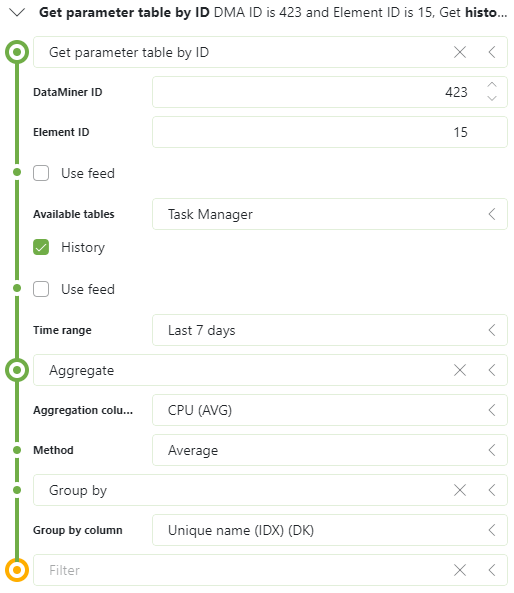
In the query, you will have a possibility to get ‘history’ data. When checking this option, the trend records for the available parameters and indices are retrieved. A row will be present for each timeslot and each index.
Typically you don’t want to use individual trend records, instead you want to have aggregated values. This can be done by aggregation (and grouping) in the query.
See below for an example:

Which has the following result:

Please let me know if you have any more questions.
Thank you very much Sebastiaan
I appreciate you availability to answer my question.
I´ll take a look on that soft launch option in our staging and talk to skyline to see if we can activate that on the production environment.
Regards