The DataMiner documentation is continuously growing and improving. That’s why from time to time we like to provide you with a summary of all things new in the DataMiner Docs.
Here’s a quick overview of the changes we’ve added to the documentation for DataMiner 10.6.1:
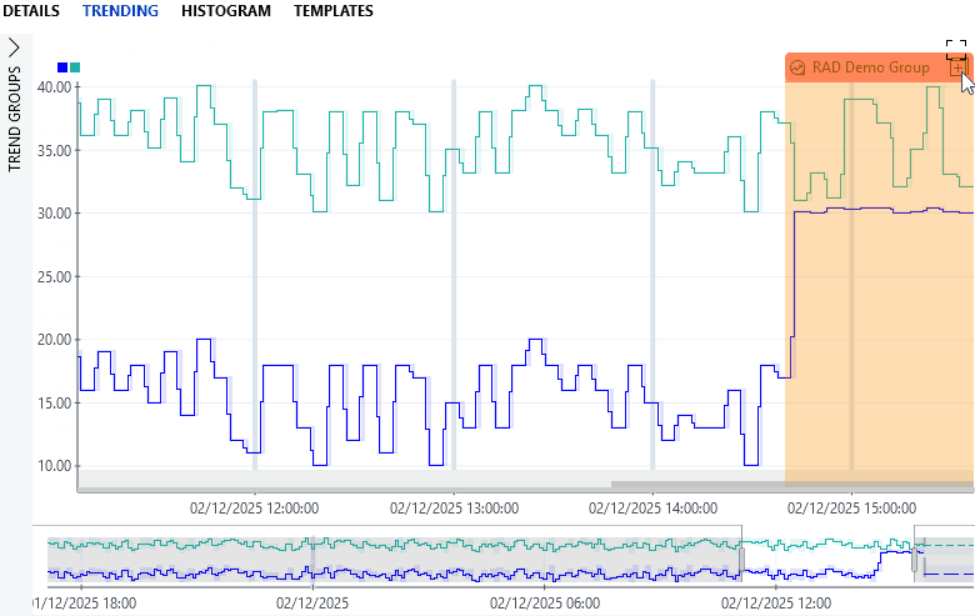
- Relational anomalies are now visible in trend graphs. They appear as tags directly on the graph, so you can immediately identify where deviations occurred.
- Node edge graphs in low-code apps now support node movement events. You can trigger custom actions when a node is repositioned, and the new Default mode setting determines whether the graph opens ready to edit or view-only.
- Preset templates are now available for grid, maps, table, and timeline components in Dashboards and Low-Code Apps — perfect for getting started quickly without designing everything from scratch.
- Sharing dashboards has become more flexible:
- Dashboard reports can now be generated not only as PDFs, but also in HTML and CSV format.
- Private dashboards can now be shared via cloud share. Previously, this was limited to public dashboards.
- GQI-related operations in DataMiner web applications now use the GQI DxM by default.
- The DomInstances CRUD helper now supports fetching only a chosen subset of fields from DomInstance objects. This minimizes data transfer and can greatly improve performance for scenarios where only a few fields are required.
- BrokerGateway-managed NATS is now the default for DataMiner Systems, delivering more robust, carefree NATS communication. When upgrading to 10.6.0 or higher, a prerequisite will verify that the DMS has completed the migration to BrokerGateway.
But those are not the only things we’ve changed recently!
- All advanced analytics features, from trend prediction to relational anomaly detection to automatic alarm grouping, are now consolidated in the new Augmented operations section.
- The Cube documentation has been restructured and expanded, including clearer explanations of the Cube start window and the Cube upgrade process.
- A short new video walks you through creating and configuring a trend template and assigning it to specific parameters of an element.
- We’re continuing the major improvement effort for the Dashboards & Low-Code Apps documentation. In this round:
- The node edge graph component page has been fully rewritten.
- New information has been added on configuring a video thumbnail in a web component.
- Tutorials have been reorganized by difficulty level so you can find the right starting point more easily.
Noticed something that could be improved in the DataMiner documentation? Your feedback can make the difference! Submit an issue or propose your changes on GitHub! If you’re a DevOps Professional, you’ll also score some points in the process 😊
Previous DataMiner releases

BLOG
What’s new in the documentation for the 10.5.12 release?
Find out what’s been added to the documentation for DataMiner version 10.5.12.
BLOG
What’s new in the documentation for the 10.5.11 release?
Find out what’s been added to the documentation for DataMiner version 10.5.11.